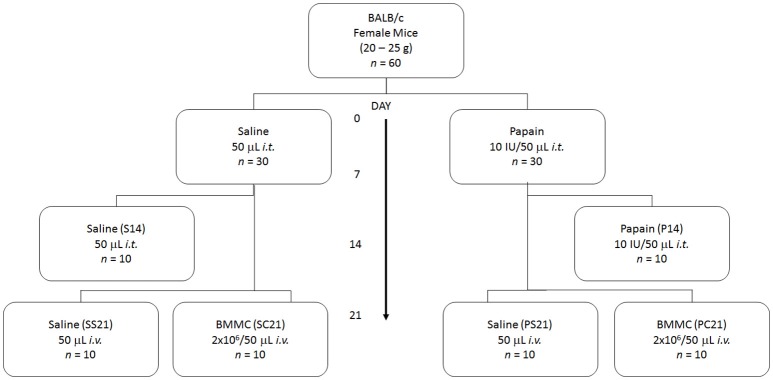
Figure 1.
Schematic flow chart and timeline of study design. On days 0 and 7 all mice received intratracheal instillation (i.t.) of saline solution or papain. On day 14 all received intravenous injection (i.v.) of saline or BMMC. Data were analyzed on days 14 and 21. S, intratracheal instillation of 50 μL of saline; P, intratracheal instillation of 10 IU of papain; S, injection of 50 μL of saline; C, injection of bone marrow mononuclear cell (2 × 10⁶/50 μL of saline).

