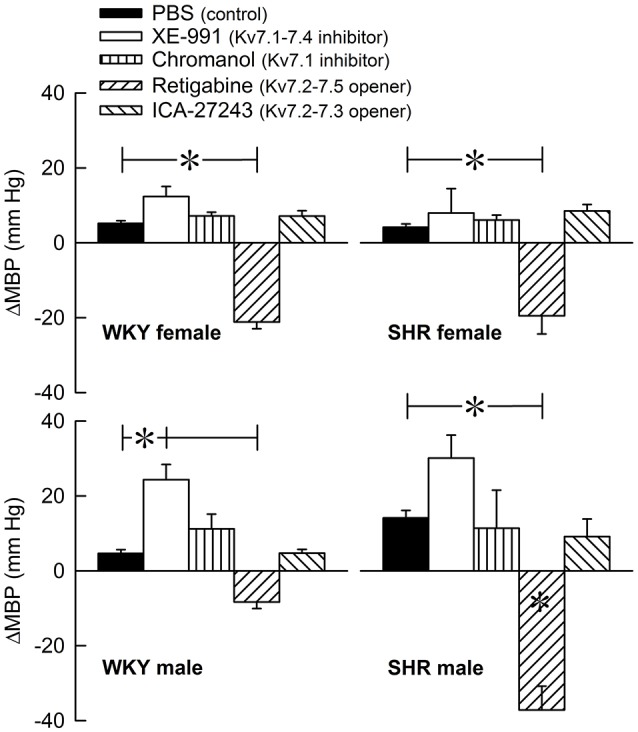
Figure 5.

The acute MBP-response to Kv7 inhibitors/openers. The MBP-response was recorded at the time of maximum change in TPR (Figure 2). The rats were injected with PBS (controls) or Kv7 inhibitor or opener, as indicated by the symbol legends. Comparisons were made between corresponding PBS-control and experimental groups, and for corresponding experimental groups across sex (none detected) or strain (*within column). Analyses were done by one-way ANOVA, followed by Student's t- or Kruskal–Wallis test. *P ≤ 0.0125.
