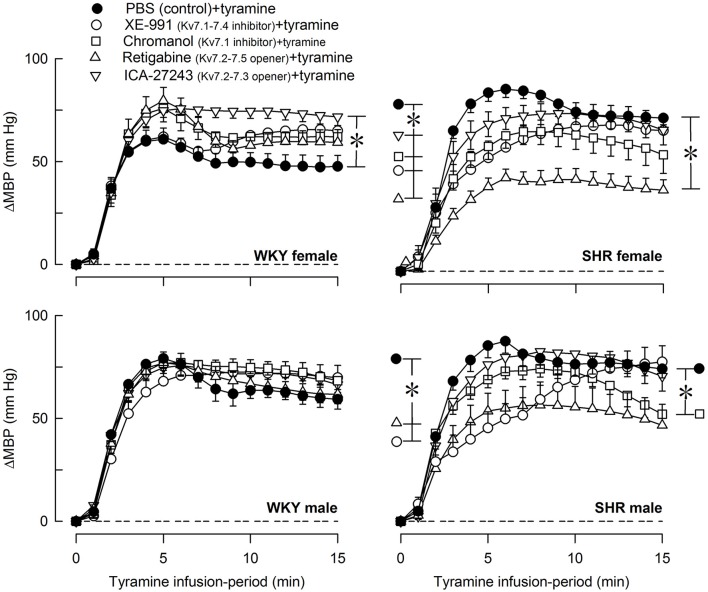
Figure 9.
The effect of Kv7 inhibitors/openers on the MBP-response to tyramine-stimulated norepinephrine release. The rats were pre-treated as indicated by symbol legends. Differences between the control and the drug-treated experimental groups at the time of the initial TPR-peak-response, i.e., at 4 min (*within brackets left of curves), and at 15 min (*within brackets right of curves) were detected as indicated, using two-sample Student's t-tests or Kruskal–Wallis tests after curve evaluation with Repeated Measures Analyses of Variance and Covariance. The MBP-response at these times was significantly different from baseline in all groups (not indicated). In the order of symbol legends, MBP prior to tyramine = 56 ± 3, 61 ± 3, 56 ± 2, 44 ± 2‡, 59 ± 3 mm Hg, 57 ± 3, 50 ± 6, 42 ± 5, 42 ± 2, 49 ± 4 mm Hg, 57 ± 2, 63 ± 3‡, 62 ± 3, 51 ± 2, 58 ± 3 mm Hg, and 69 ± 4†, 59 ± 7, 69 ± 9, 55 ± 5, 67 ± 6 mm Hg in female WKY and SHR and male WKY and SHR sets of groups, respectively (P ≤ 0.0125 for strain- (*), sex- (), or drug- (‡) related differences in the baselines). *P ≤ 0.025 (please see the Materials and Methods section for details).

