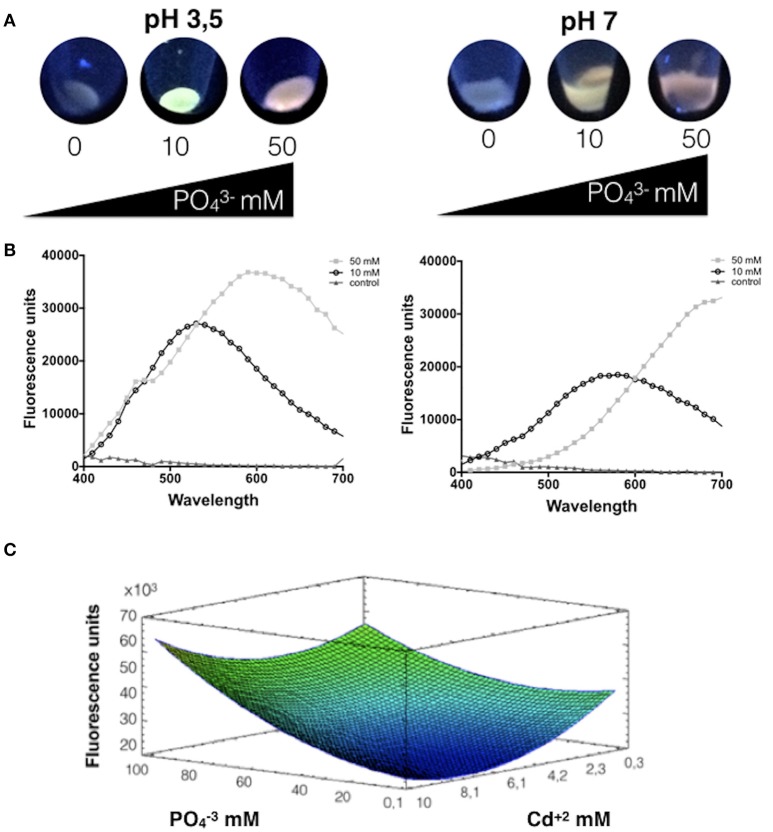
Figure 1.
Phosphate favors the biosynthesis of CdS-QDs at pH 3.5. (A) Fluorescence of cells exposed to CdS-QDs biosynthesis conditions during 24 h in presence of different phosphate concentrations (Cd2+ 0.66 mM and phosphate 0, 10, or 50 mM). Fluorescence was evaluated after exposure to UV light (360 nm). (B) The emission spectra show the fluorescence peaks for each condition at pH 3.5 (left) and pH 7.0 (right). (C) Response surface for a two variables model for the effect of cadmium and phosphate on A. ferrooxidans QDs production in supernatants, determined as fluorescence emission (R2: 72%; p < 0.05). Warm colors represent an increase in value for the variable under study.

