. 2018 Feb 26;7:e32341. doi: 10.7554/eLife.32341

Figure 2. Validation of Dam chromatin accessibility profiling compared to ATAC and FAIRE-seq.

(A) Chromatin accessibility across chromosome three as determined by ATAC-seq, FAIRE-seq, and CATaDa. Note the reduced amount open chromatin proximal to the centromere regions in all three datasets. y-axes = reads per million (rpm). (B) Example locus showing data obtained by FAIRE, ATAC, and CATaDa. Peaks are broadly reproducible across techniques. (C) Aggregation plot of CATaDa signal at TSS with 2 kb regions up and downstream. Aggregated signal at TSS shows expected enrichment of Dam. (D) Aggregation plot of CATaDa signal at ATAC or FAIRE peaks, indicating enrichment of CATaDa signal at these loci. (E) Identification of ATAC peaks in CATaDa or FAIRE data. CATaDa and FAIRE identify 48.6% and 55.9% of ATAC peaks, respectively. FAIRE-seq peaks overlap more frequently with promoter proximal peaks (2 kb from TSS), whilst CATaDa peaks overlap with more ATAC peaks outside of promoter regions.

Figure 2.

Figure 2—figure supplement 1. Correlation between CATaDa replicates.

Figure 2—figure supplement 1.

Correlation between CATaDa replicates for all cell types assayed in this study shows good agreement, indicating that the technique has high reproducibility. p<2.2 × 10⁻¹⁶ for all replicates, indicating highly significant correlations.
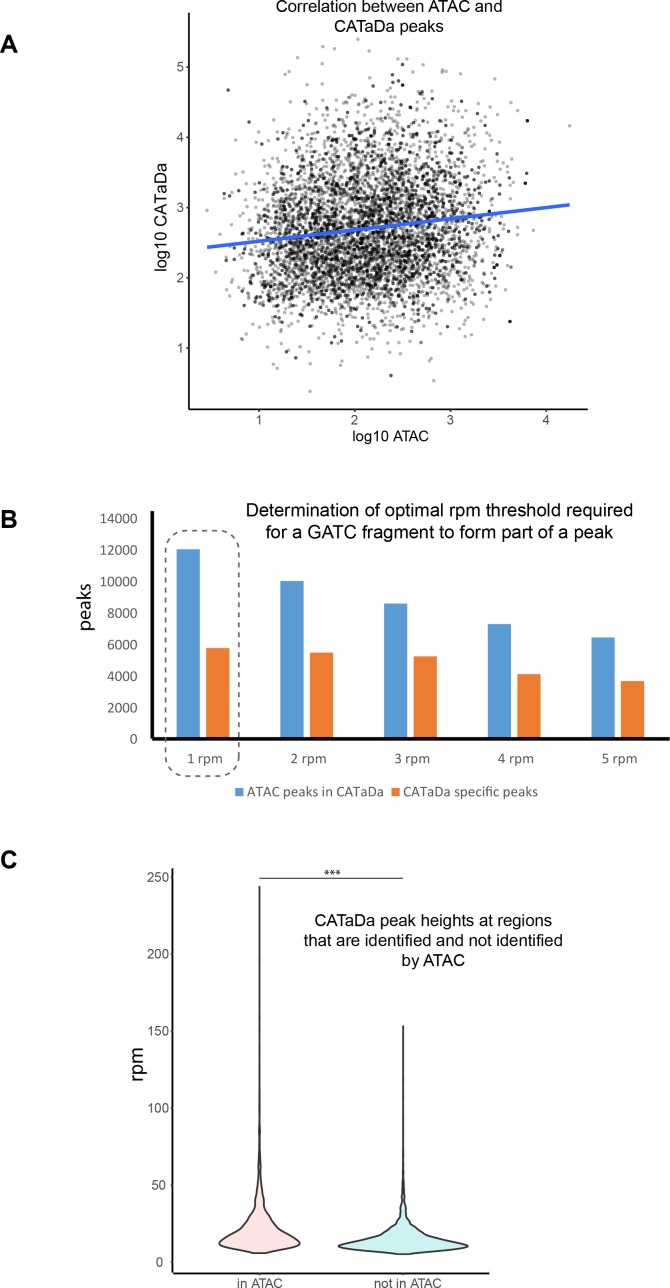
Figure 2—figure supplement 2. Further comparison of CATaDa and ATAC data.

Figure 2—figure supplement 2.

(A) Correlation between peaks called in ATAC-seq and CATaDa. p<2.2 × 10⁻¹⁶, r2 = 0.137967. (B) Thresholding of peak calling at lower rpm values results in a higher proportion of ATAC peaks being identified whilst having little effect on the number of peaks identified, which are seen in CATaDa data, but not ATAC. (C) Peaks identified only in CATaDa are significantly smaller than those seen to overlap with ATAC peaks. p<1 × 10⁻¹⁶.
Figure 2—figure supplement 3. Frequency of GATC sites at various genomic features.

Figure 2—figure supplement 3.

(A) Frequency of GATC sites at peaks identified by ATAC-seq in eye-discs. There is a clear reduction of GATC frequency at loci corresponding to peaks which were identified with ATAC, but not CATaDa (green), compared to peaks identified by both methods (blue). (B) Frequency of GATC sites at peaks identified by FAIRE-seq in eye-discs. There is a clear reduction of GATC frequency at loci corresponding to peaks which were identified with FAIRE, but not CATaDa (green), compared to peaks identified by both methods (blue). (C) Frequency of GATC sites around transcriptional start sites (TSS). Promoter regions have a depletion of GATC sequences.