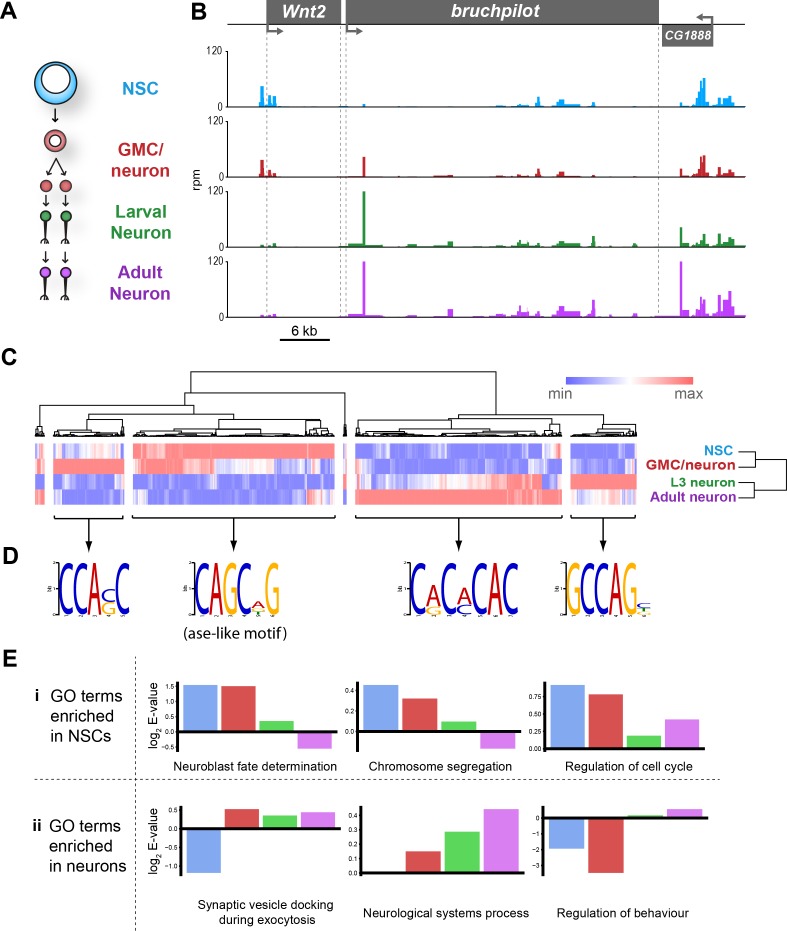
Figure 4. Chromatin accessibility of cell types in the CNS.
(A) Schematic of CNS lineage progression indicating cell types examined in this study. (B) Example profiles resulting from Dam expression in the CNS. Genomic region encompassing Wnt2 and bruchpilot genes is shown. Multiple open chromatin regions are dynamic across development. Y-axes = reads per million (rpm). (C) Clustering of differentially accessible regions in CNS lineages indicates two major groupings in which chromatin is most accessible in either stem cells or mature neurons. (D) Motif analysis using these sequences results in identification of expected motifs (e.g. ase E-box motif in stem cell accessible loci), as well as novel motifs. Most highly enriched motifs for each cluster shown. All motifs E-values < 1 × 10⁻⁵. (E) log2 enrichment scores for selected GO terms in individual cell types. Clear trends can be seen as development progresses. (NSC, GMC, L3 neuron, adult neuron - from left to right). (i) GO terms are either enriched in stem cells becoming less significant as the lineage progresses or (ii) vice versa.


