. 2018 Feb 14;7:e31510. doi: 10.7554/eLife.31510

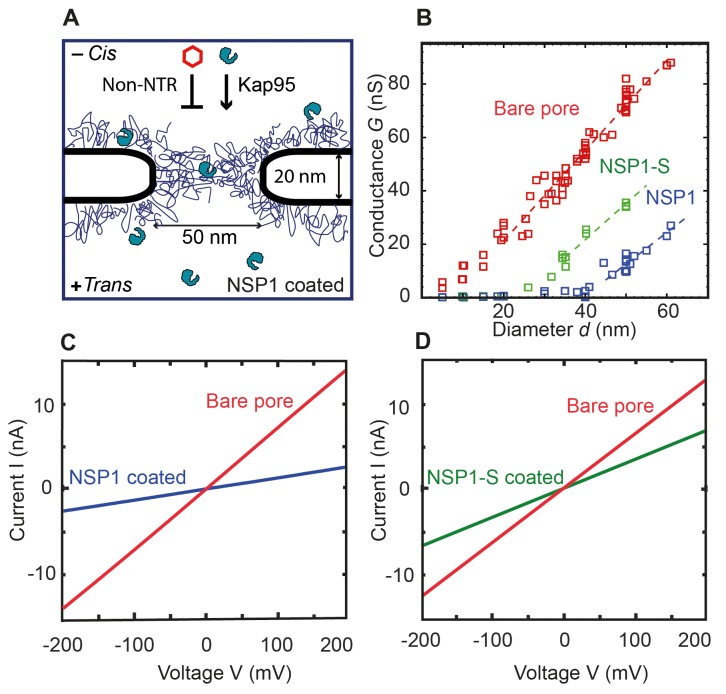
Figure 1. Coating a nanopore with FG-Nups reduces the pore conductivity.

(A) Schematic of the biomimetic NPC where yeast FG-Nup Nsp1 is coated onto a solid-state nanopore of diameter 50 nm and thickness of 20 nm. Kap95, a yeast importer, can pass through the barrier, whereas most other proteins such as tCherry fail to pass through the pores. (B) Conductance versus pore diameter for bare pores (red), Nsp1-coated pores (blue), and Nsp1-S-coated pores (green). The conductance is low (<4 nS) for small-diameter biomimetic pores, below a threshold diameter 41 ± 2 nm and 26 ± 3 nm, for Nsp1 and Nsp1-S respectively. Above this threshold diameter, the conductance increases linearly with slope similar to that of the bare pore conductance. Dashed lines are linear guides to the eye. (C and D) Current vs voltage curves for a 50 nm pore before (red) and after Nsp1 coating (blue). The conductance drops by about 80% after coating, confirming a high density of Nsp1 inside the nanopore. (D) Current vs voltage curves for a mutant Nsp1-S-coated (green) 50 nm pore. Here the conductance drops by about 50% compared to the bare pore (red).

Figure 1.

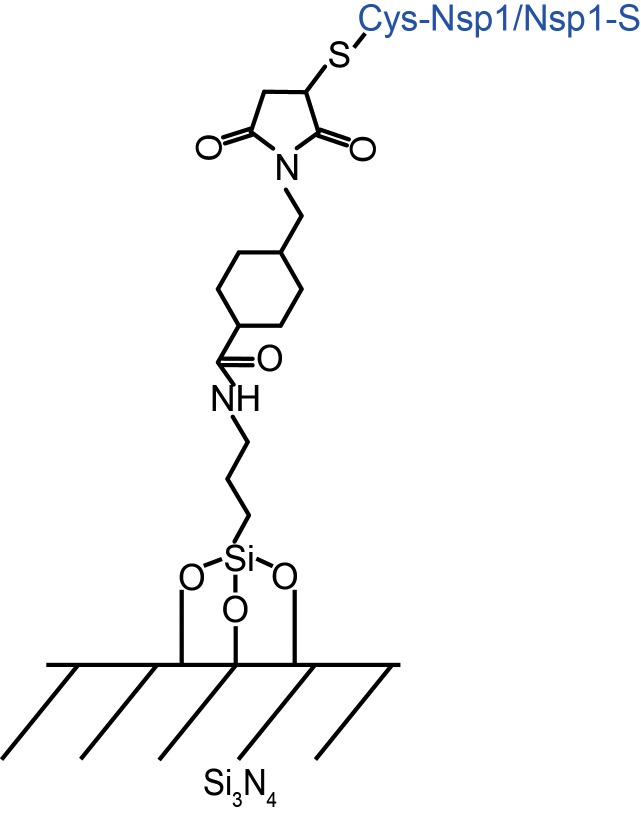
Figure 1—figure supplement 1. Self-assembled monolayer surface chemistry for covalently attaching Nsp1 and Nsp1-S to Silicon Nitride membrane.

Figure 1—figure supplement 1.

The APTES layer was used as a primary monolayer through silanization. Next, the NHS-ester with a maleimide reactive group (Sulfo-SMCC) was coupled to the APTES monolayer. The exposed maleimide functioned as a binding group to C-terminal cysteine.
Figure 1—figure supplement 2. Current power spectral density of a bare pore and nanopores coated with Nsp1 and Nsp1-S, versus frequency.
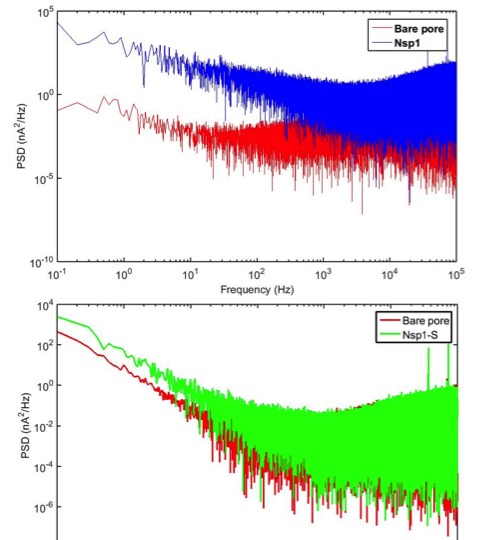
Figure 1—figure supplement 2.

From the spectrum of the Nsp1 pore it is evident that the 1/f noise increases drastically compared to the bare pore (Smeets et al., 2008). This is a clear indication of the fluctuations of Nsp1. A similar trend is observed for Nsp1-S coated pores.
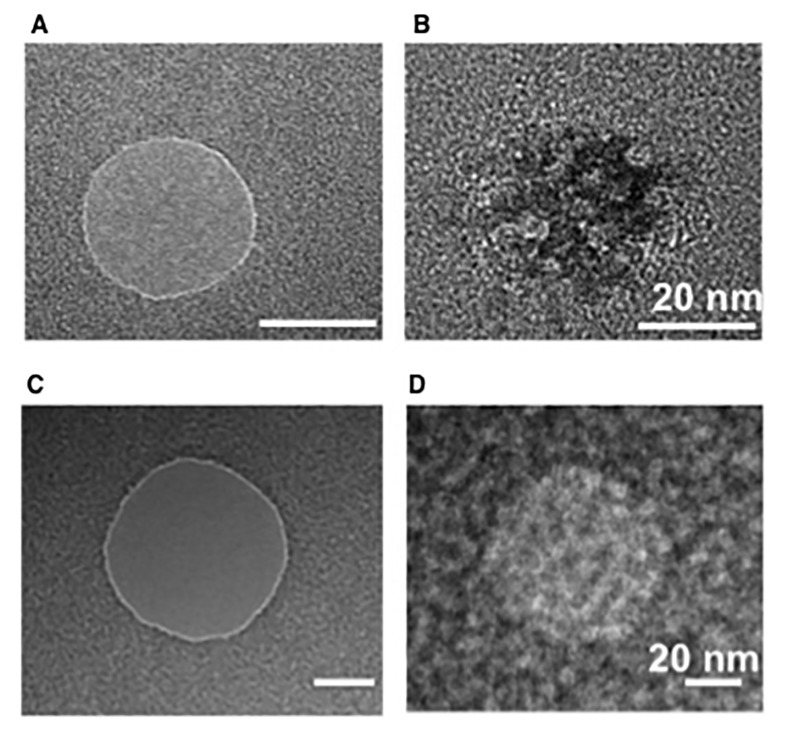
Figure 1—figure supplement 3. Transmission electron microscopy (TEM) images of bare and Nsp1-coated pores.

Figure 1—figure supplement 3.

(A, B) 30 nm pores and (C,D) 50 nm pore before and after Nsp1 coating respectively. While these images of dried pores do not necessarily represent the intrinsic mass distribution, they serve to deduce the presence of Nsp1 in both (B) and (D). These TEM images show a higher density of Nsp1 in the 30 nm nanopores, which is in agreement with the conductance measurement with nanopore.
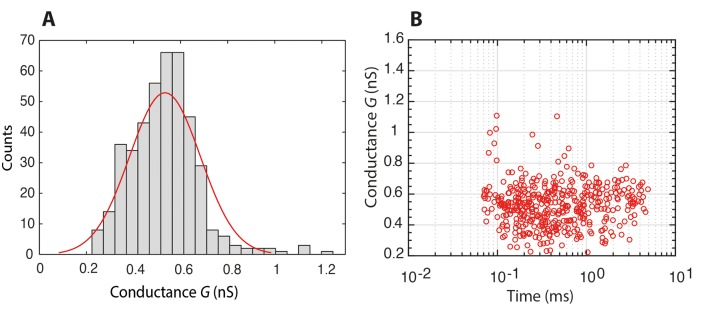
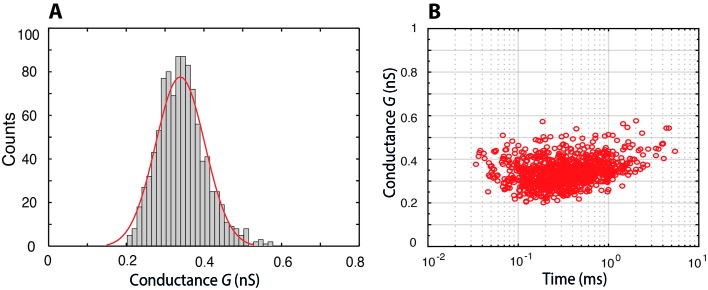
Figure 1—figure supplement 4. Histogram of the conductance of individual Nsp1 molecules translocating through a bare pore, and the associated scatter plot of conductance versus translocation time.

Figure 1—figure supplement 4.

Figure 1—figure supplement 5. Histogram of the conductance of individual Nsp1-S molecules translocating through a bare pore, and the associated scatter plot of conductance versus translocation time.

Figure 1—figure supplement 5.

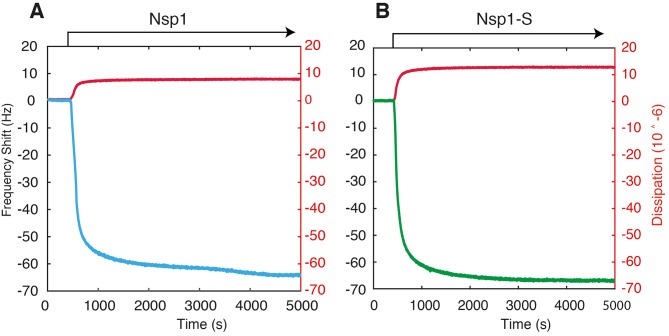
Figure 1—figure supplement 6. Example QCM-D traces for the surface functionalization of Nsp1 (A) and Nsp1-S (B) on silicon nitride coated with APTES and Sulfo-SMCC.

Figure 1—figure supplement 6.

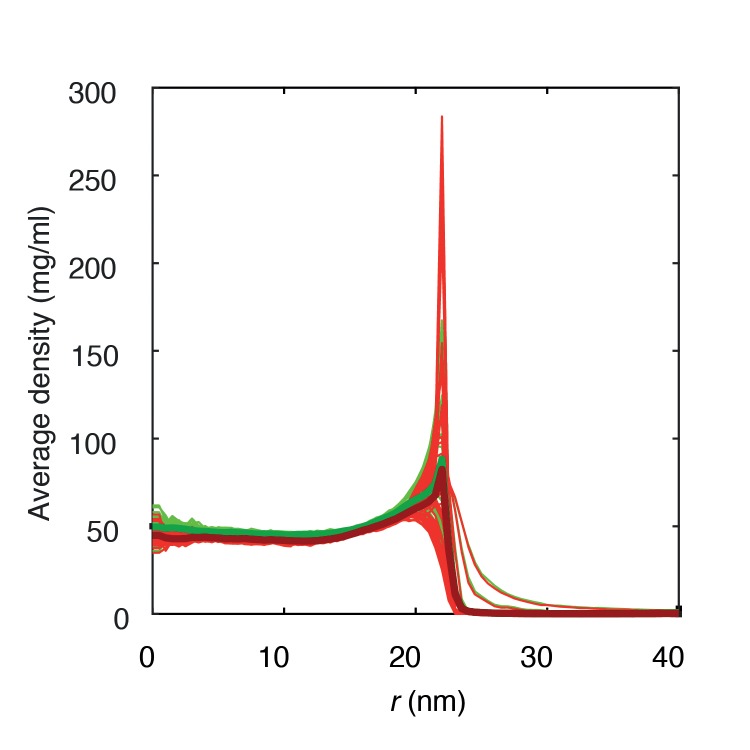
Figure 1—figure supplement 7. Average protein densities of a Nsp1-S coated solid-state nanopore of diameter 45 nm with grafting distance 5.7 nm (green) and 5.9 nm (red).

Figure 1—figure supplement 7.