
Figure 3. Radial density distribution and conductance data for Nsp1 and Nsp1-S biomimetic pores.
(A) Radial protein density distribution for biomimetic nuclear pores with pore diameters of 22 nm, 45 nm, and 60 nm, for pores coated with Nsp1 (blue) and Nsp1-S (green). All data are taken within the height of the cylinder (20 nm; −10 nm <z < 10 nm) that is divided into 20 equally spaced discs of thickness 1 nm each. Each of the 20 curves represented in each panel shows the radial density distribution for that specific z location. (B) Modeling results for the conductance as a function of pore diameter for Nsp1-coated pores (blue) and Nsp1-S-coated pores (green). The dashed lines are linear guides to the eye. The inset shows a comparison between the computed and the experimental conductance. (C) Conductance versus pore diameter for the experimental (open symbols) and modeling data (closed symbols). For Nup-coated pores, the conductance is low (G < 4 nS) for small diameters, but it increases strongly with a non-linear dependence on pore diameter beyond ~40 nm for Nsp1 and beyond ~20 nm for Nsp1-S. At larger diameters the conductance increases almost linearly with a slope slightly smaller than that of the bare pore, with G-values of tens of nS. The red solid line corresponds to Equation (1) for the bare pore and the green and blue solid lines correspond to Equation (2) with the conductivities for the access and pore regions obtained by fitting the numerical results using sigmoidal functions (see Figure 3—figure supplement 2 ).

Figure 3—figure supplement 1. Conductance as a function of pore diameter below 40 nm.
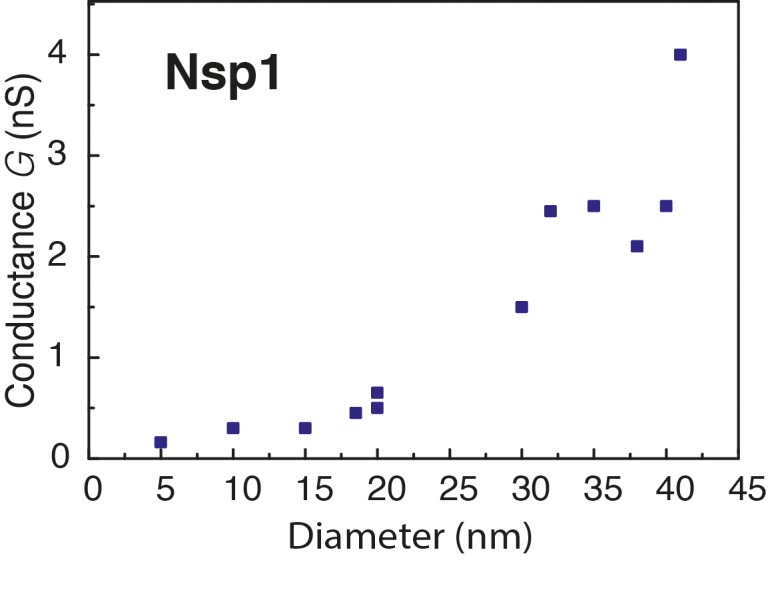
Figure 3—figure supplement 2. The conductivity in the pore region () and access region () for the simulated nanopores lined with Nsp1 (blue circles; panel A) and Nsp1-S (green circles; panel B) plotted as a function of pore diameter.

Figure 3—figure supplement 3. The conductivity and conductance for the simulated nanopores lined with Nup98 as a function of pore diameter.

Figure 3—figure supplement 4. Computed conductance vs the experimentally measured conductance, for (A) Nsp1 (blue circles) and Nsp1-S (green circles), and (B) Nup98 (black circles).
