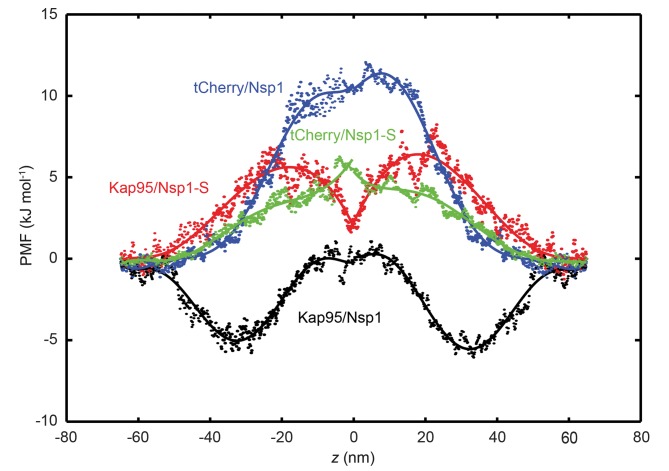
Figure 6. Potential of mean force (PMF) curves associated with transport of tCherry and Kap95 through Nsp1 and Nsp1-S coated pores.
PMF values for tCherry and Kap95 particles at different positions along the central axis (r = 0). Kap95 in the Nsp1 and in Nsp1-S pore is represented in black and red, respectively, and tCherry in Nsp1 and Nsp1-S is shown in blue and green, respectively. Solid lines represent polynomial fits of 6th order for z < 0 and z > 0. The data show that the energy barrier that tCherry needs to overcome to move across the Nsp1-lined pore is approximately 12 kJ/mol, while for Kap95, it is much lower, 6 kJ/mol. For the Nsp1-S pore however, the barriers are very similar for Kap95 and tCherry, viz., 6.5 kJ/mol and 6.4 kJ/mol, respectively.

