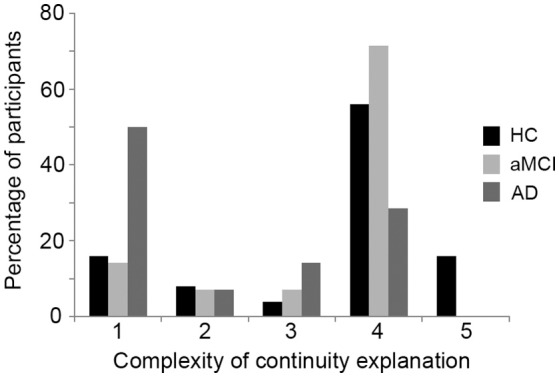
Figure 3.

Percentage of participants from each group providing each level of sophistication of response on the persistence explanation. HC, Healthy control; aMCI, amnestic Mild Cognitive Impairment; AD, Alzheimer's disease. Scores of 1 represent the lowest level of sophistication, while scores of 5 indicate the highest level of sophistication.
