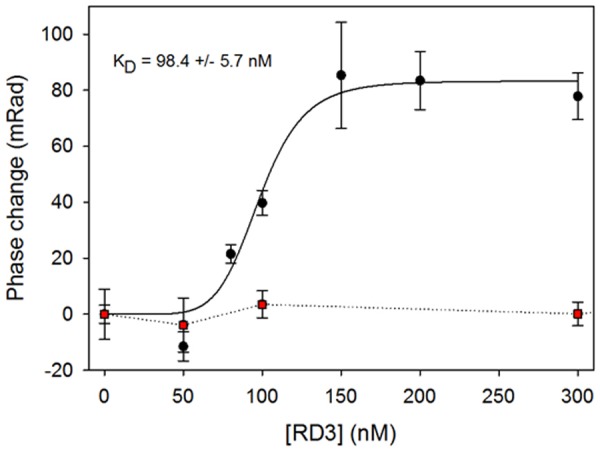
FIGURE 6.

RD3 and GUK interaction detected by Back Scattering Interferometry (BSI). Various RD3 concentrations ranging from 0 to 300 nM were tested for interaction with GUK (black dots) by BSI. Titration of a control protein (TEV) to GUK showed no binding (red squares). Titration series is an example of three independent experiments. Each symbol is the mean ± SD of five data points. Curve fitting was performed with SigmaPlot 13 using a normal Hill equation.
