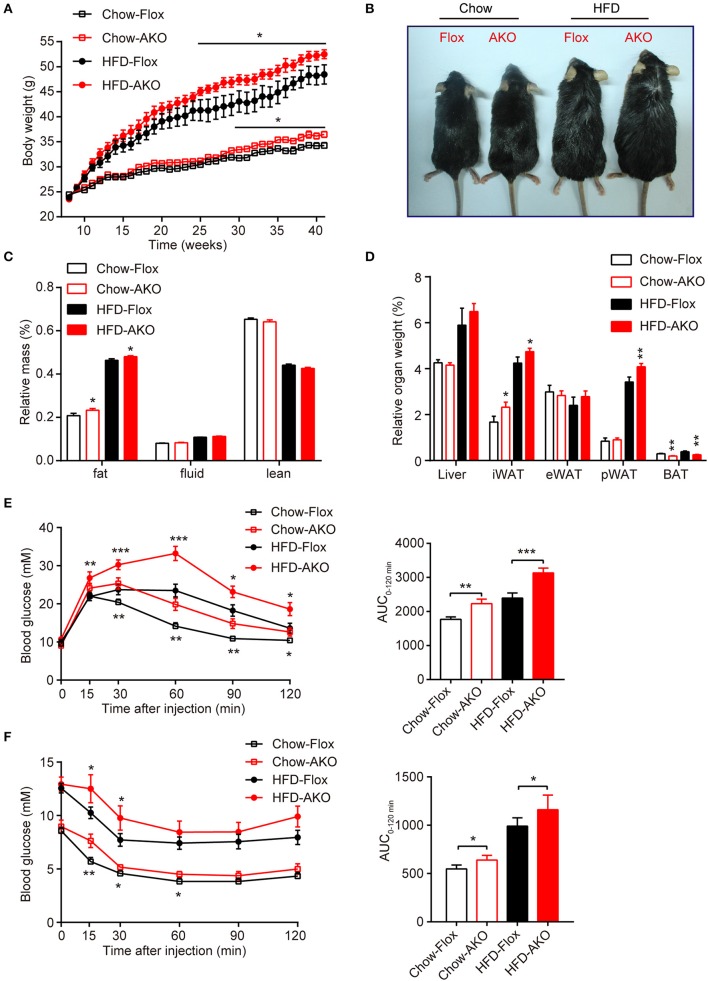
Figure 2.
Adipose-specific AMPKα deletion exacerbated high-fat diet (HFD)-induced adiposity and glucose intolerance. (A) Change in body weight of AKO mice and age-matched floxed littermates during the indicated period. (B) Representative images of 41-week-old male AKO mice and age-matched flox/flox mice. (C) Fat mass, fluid mass and lean mass relative to the total body weight of 40-week-old mice. (D) Relative weight of the liver, iWAT, eWAT, pWAT, and BAT to the total body weight of mice. (E) Blood glucose levels from the intraperitoneal glucose tolerance test (ipGTT) of 20-week-old mice following a single injection of glucose (2 g/kg) (left). The area under the curve (AUC) of the ipGTT during the indicated times was calculated as the blood glucose multiplied by the time (mM*min) (right). (F) Blood glucose levels of 30-week-old mice following a single injection of insulin (0.75 U/kg) in the intraperitoneal insulin tolerance test (ITT) (left). The AUC of the ITT is shown (right). Chow-Flox: AMPK α1/α2-floxed mice fed a chow diet, Chow-AKO: adipose tissue-specific AMPK α1/α2 KO mice fed a chow diet, HFD-Flox: AMPK α1/α2-floxed mice fed a HFD, HFD-AKO: adipose tissue-specific AMPK α1/α2 KO mice fed a HFD. Data are presented as the means ± SEM. n = 11–15. Student's t-test. *P < 0.05, **P < 0.01, ***P < 0.001 compared with the corresponding Flox group.

