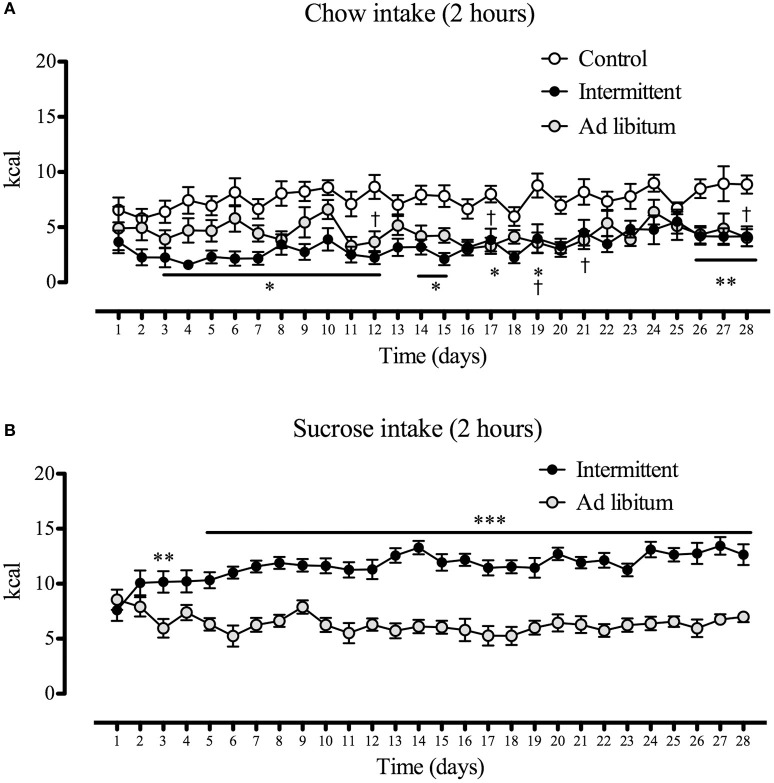
Figure 3.
Daily energy intake from chow (A) and from the sucrose solution (B) of animals during the 28 days of exposition to the sucrose solution (control, n = 14; intermittent, n = 16; ad libitum, n = 13). Food and sucrose solution intake were measured in grams during a 2-h period, converted to kcal and expressed as means ± S.E.M. (A) *p < 0.05, **p < 0.01 intermittent group vs. control group; †p < 0.05 ad libitum vs. control group. (B) **p < 0.01, ***p < 0.001 intermittent group vs. ad libitum group.

