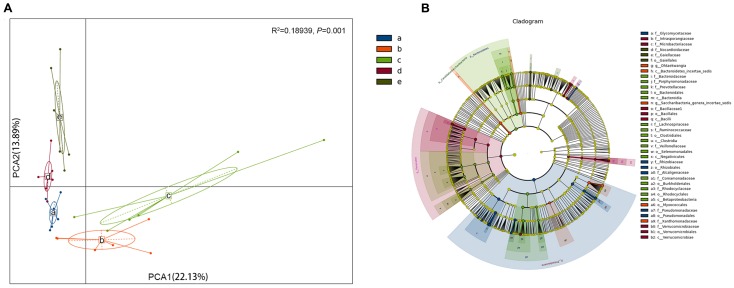
FIGURE 3.
Analysis of the bacterial species in the roots of different sugar cane species shows significant differences in the endophytic bacteria communities. (A) Principal component analysis (PCA) shows the grouping patterns of the four sugarcane species based on weighted UniFrac distance. Each colored dot represents a sample. Adonis test: R2 = 0.18939, P = 0.001. (B) Linear discriminant analysis (LDA) and effect size (LEfSe) analysis were used to determine the significant discriminative taxa between the four sugarcane species (LDA score threshold: ≥3.5). Different colored regions represent different species. The circles from inside to out represent the classification levels from the phylum to genus (or species). Each small filled circle represents a classification at this level, and size is proportional to relative abundance. (a) S. officinarum; (b) S. barberi; (c) S. robustum; (d) commercial cultivars; (e) S. spontaneum.

