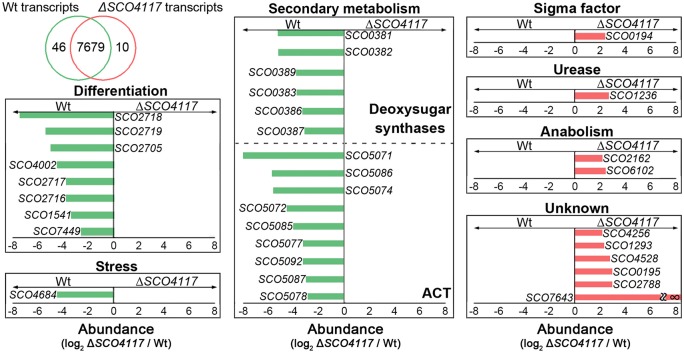
Figure 5.
Transcriptomic analysis of the ΔSCO4117 mutant and the S. coelicolor wild-type strain. ΔSCO4117 mutant vs. S. coelicolor transcriptome at 44 h on solid GYM cultures. Venn diagram shows transcripts with significant up-regulation (p-value < 0.03) in the wild-type strain (46 transcripts) or the ΔSCO4117 mutant (10 transcripts) and transcripts without significant variations (7,679 transcripts). Histograms show the abundance of the transcripts with significant variations (p-value < 0.03) discussed in the text. Abundance values (average from two biological replicates) are shown. Green bars indicate transcripts up-regulated in the S. coelicolor wild-type strain. Red bars indicate transcripts up-regulated in the SCO4117 mutant.

