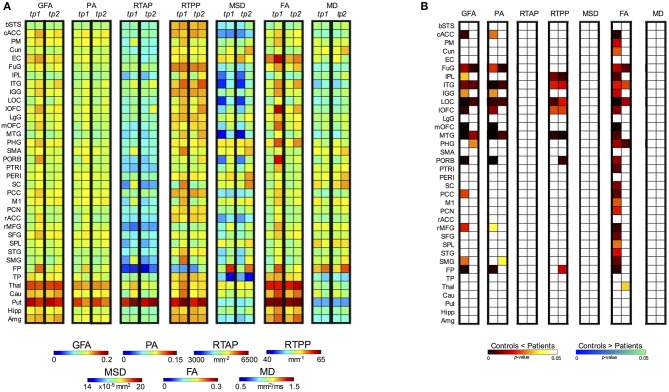
Figure 7.
Post-hoc test results for the three-way mixed ANOVA (controls vs. patients). (A) For each index and each time point (tp) block, the first column represents the mean values for the controls while the second column the mean values for the patients. (B) Post-hoc results expressed in terms of p-values for the significant interactions between Group, TP and Region (ROI). Two different colormaps are used to display the p-values for the ROIs with significant differences between control and patient mean values (hot: Controls < Patients; cold: Controls > Patients). These values (p < 0.05) are Bonferroni corrected for multiple comparisons.

