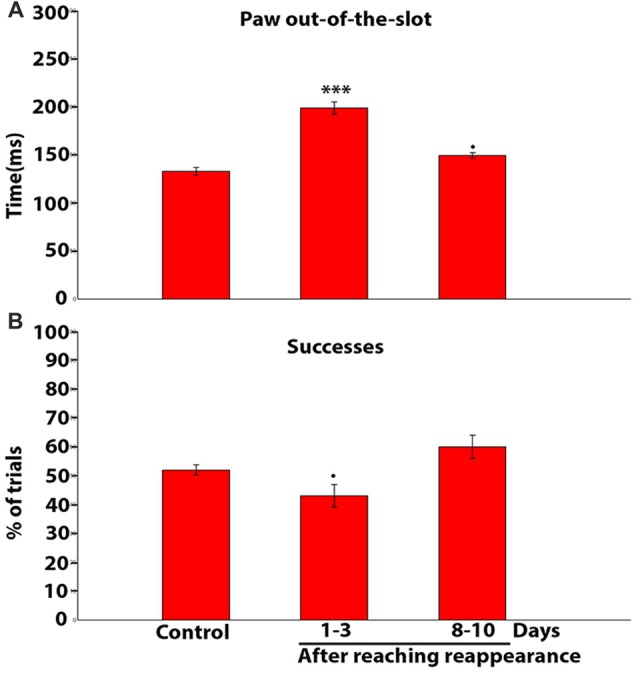
Figure 10.

(A) Population data histogram showing the average time spent by the paw beyond the slot during reaching-grasping-retracting movement. Each bar shows the mean and standard error in ms. Note that the time is significantly increased with respect to control at 1–3 days (***P = 0.0001, chi square test); and is slightly increased on days 8–10 (•P = 0.0523, chi square test). (B) Population data histogram of the success percentage in controls and after reaching reappearance in ION severed rats. Note that the success percentage is slightly reduced only on days 1–3 after reaching reappearance (•P = 0.0952, chi square test).
