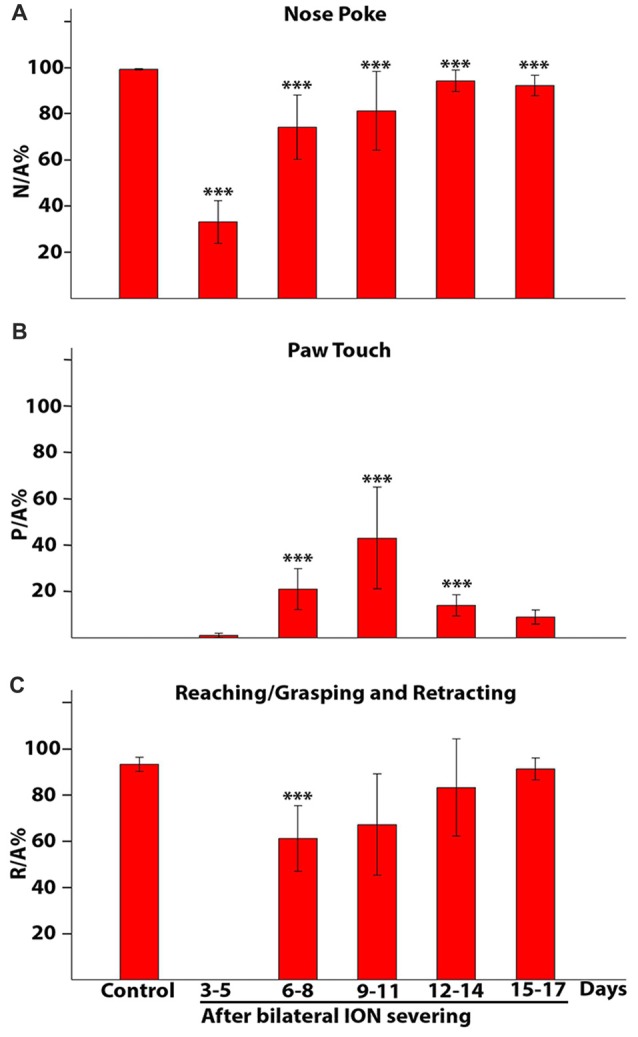
Figure 9.

Percentage of nose poke (A), paw touch (B) and reaching/grasping (C) expressed as a ratio with respect to the approaches. The histograms present data from five rats collected in control conditions and at different time intervals after bilateral ION severing. Each bar shows the mean and standard error. (A) Nose poke percentage expressed as a ratio with respect to the approach (N/A%). Note that in controls all approaches to the front wall are followed by insertion of the nose into the slot (100%), whereas 3–5 days after surgery, in about 70% of the approaches the rat fails to insert its nose into the slot and in subsequent days percentages are still significantly lower than in controls (***P = 0.000, pair-wise comparison of proportion). (B) Paw touch percentage expressed as a ratio with respect to the approach (P/A%). Note that paw touch is not present in controls and showed the greatest increase over 9–11 days (3–5 days vs. other groups: ***P = 0.000, pair-wise comparison of proportion). (C) Reaching/grasping percentage expressed as a ratio with respect to the approach (R/A%). Note that movements are totally absent 3–5 days after the lesion, reappear in the following days and at 6–8 days are still significantly different from control (***P = 0.000, pair-wise comparison of proportion).
