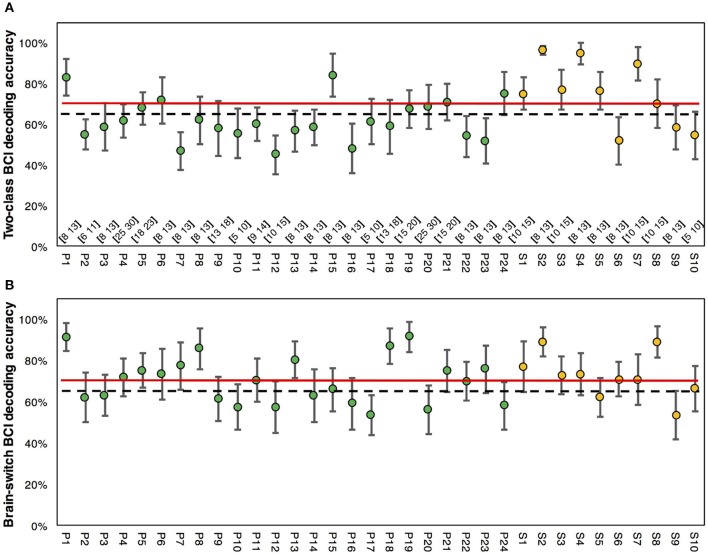
Figure 2.
MI-BCI decoding accuracies of stroke patients and healthy subjects. (A) Two-class BCI decoding accuracy of all subjects. Selected individual frequency bands are presented on the bottom. (B) Brain-switch BCI decoding accuracy of all subjects. The green markers indicate the results of stroke patients, whereas the yellow markers indicate results of healthy subjects. The red lines represent the accuracy level of 70% for BCI-inefficiency, and the black dash lines represent the trial-number corrected chance level of 65% with p = 0.05. The error bars represent standard errors.

