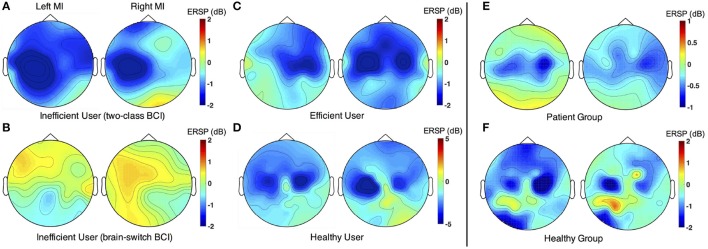
Figure 3.
Comparison of ERSP spatial distribution between different MI tasks. In each subplot, the left and right topographic maps are corresponding to left- and right-hand MI, separately. (A) ERSP spatial distribution of a representative subject (P8) from the Inefficient-Group in two-class BCI. (B) ERSP spatial distribution of a representative subject (P16) from the Inefficient-Group in brain-switch BCI. (C) ERSP spatial distribution of a representative subject (P21) from the Efficient-Group in both two-class BCI and brain-switch BCI. (D) ERSP spatial distribution of a representative subject (S8) from the Healthy-Group. (E) Grand average topographic maps for all stroke patients. ERSP distributions of the patients with paralysis on left side were vertically mirrored in order to illustrate the effect of lesion side on ERSP patterns. Thus, the left and right subplots represent un-paretic and paretic hand MI, respectively. (F) Grand average topographic maps for all healthy subjects. The representative subjects in (A,B) were patients with paralysis on the left side, whereas the representative subject in (C) was a patient with paralysis on the right side. The maps were drawn within the selected individual frequency bands. ERSP values were averaged at [1 4] s and normalized by subtracting the baseline power at [−2 −1] s with respect to the starting cues.

