FIGURE 2.
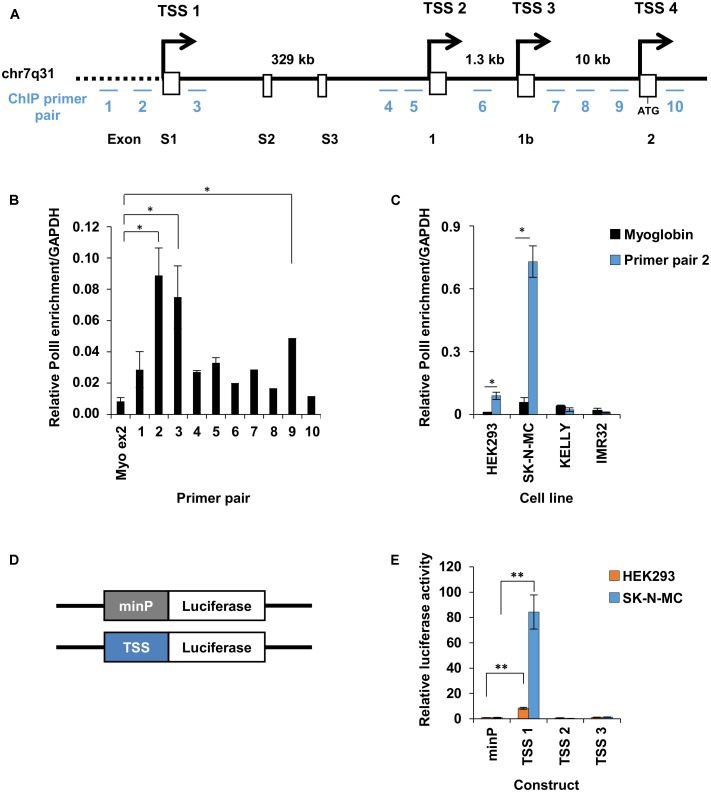
Promoter 1 of FOXP2 drives endogenous expression. (A) Linear representation of the genomic location on chromosome 7q31, encompassing the 5′ end of the FOXP2 gene. The first exons of FOXP2, from exon S1 to exon2 are shown as white boxes with promoters and transcriptional start sites (TSSs) at exon S1, 1, 1b and 2 indicated by arrows. The first upstream ATG start codon is located in exon 2. The relative location of the ten qPCR primer pairs used for RNAPolII ChIP are indicated by blue lines and numbered 1–10. (B) RNA polymerase II (RNAPolII) occupancy at the promoter regions of FOXP2, as measured by ChIP-qPCR. The relative PolII occupancy in HEK293 cells is shown for each primer pair and for myoglobin exon 2, which is used as a negative control. RNA-PolII occupancy is normalized to a positive control region at the GAPDH promoter. (C) Normalized PolII occupancy at TSS1 primer pair 2 and myoglobin exon 2 (negative control) is shown for the cell lines HEK293, SK-N-MC, KELLY, and IMR32. The qPCR was performed in duplicate. Significance was determined in comparison to the negative control by ANOVA followed by post hoc Tukey tests. ∗p < 0.05. (D) Schematic representation of the firefly luciferase constructs tested in (E). Promoter elements (TSS) were cloned to replace the minimal promoter (minP) in pGL4.23. (E) Relative luciferase activity of promoter elements driving firefly luciferase gene expression in HEK293 and SK-N-MC cells. The promoter constructs were co-transfected with the pGL4.74 control plasmids expressing the renilla luciferase under the control of a herpes simplex virus thymidine kinase (HSV-TK) promoter. The firefly luciferase signal was divided by the renilla signal to derive the relative luciferase activity. The activity for each luciferase construct was normalized for the activity observed for the minimal promoter (minP). The constructs were measured in two independent experiments in a total of six biological replicates. The statistical significance of the difference between each construct and minP was determined with two-way ANOVA and post hoc LSD testing. ∗p < 0.05, ∗∗p < 0.001.

