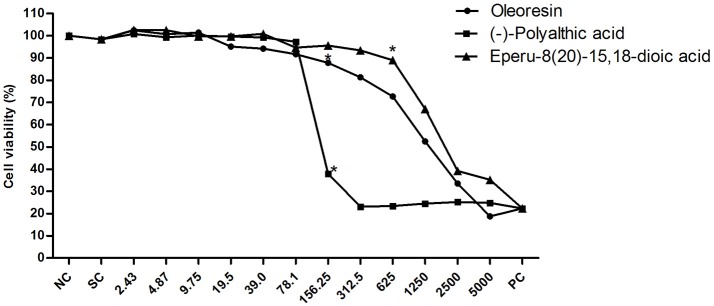
Figure 5.
Cell viability of the V79 cell line when exposed to different concentrations of the Copaifera duckei Dwyer oleoresin, (–)-polyalthic acid, and eperu-8(20)-15,18-dioic acid as assessed by the XTT colorimetric method. The values are the mean and standard deviation. *Significantly different from the negative control group (P < 0.05). IC50 values were 777.4 ± 8.3; 127.93 ± 10.97, and 1441.33 ± 13.43 for oleoresin, (–)-polyalthic acid and eperu-8(20)-15,18-dioic acid, respectively.

