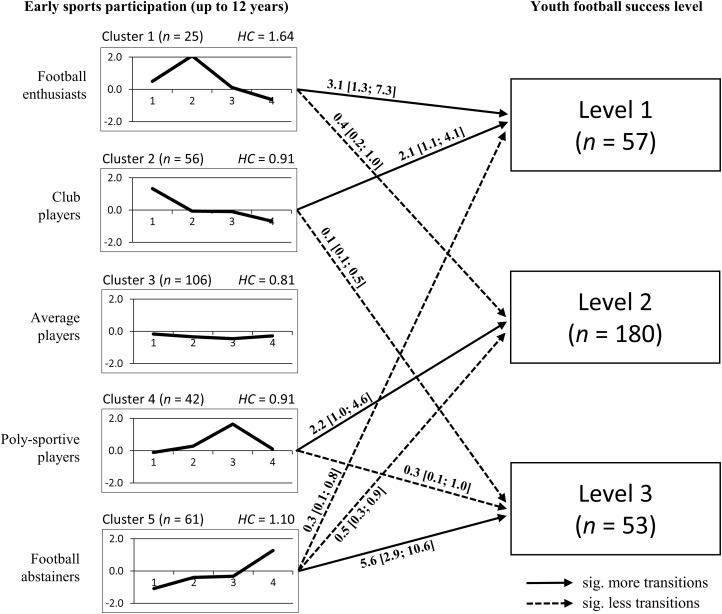
FIGURE 2.
Profiles of z-scores of the five clusters and transitions to youth football success levels (EESS = 52.1%; weighted HCmean = 0.97; SC = 0.52). Operating factors: 1 = hours of in-club football practice; 2 = hours of free play within football; 3 = hours of sports activities besides football; 4 = age at initial football club participation; Success levels: 1 = national players; 2 = regional players; 3 = local players; numbers for significant more (OR > 1.0) or less (OR < 1.0) transitions are expressed as odds ratios and 95% confidence intervals.

