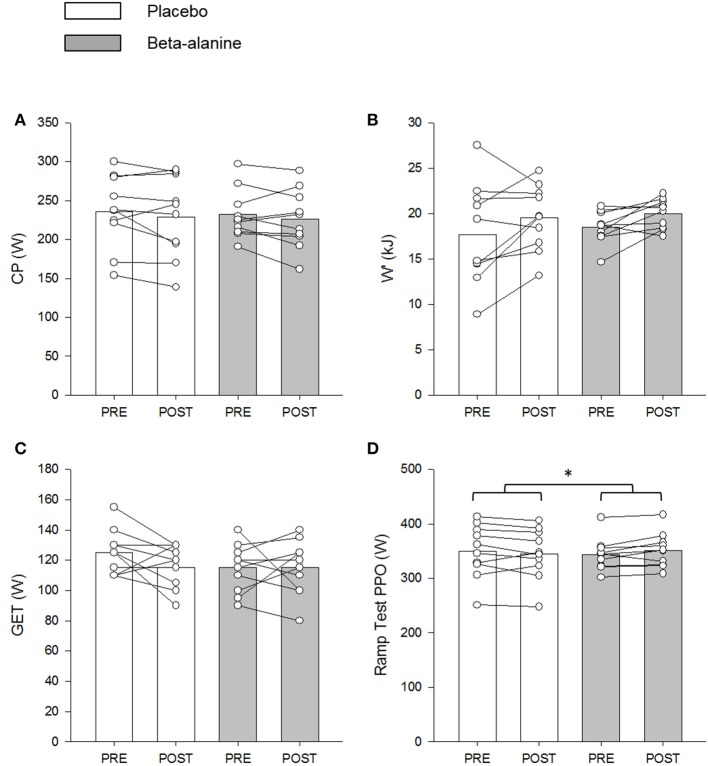
Figure 5.
The placebo (PL; white) and β-alanine (BA; gray) group mean and individual critical power (CP; A) and W′ (B) determined during the 3-min all-out test, and power output at GET (C) and peak power output (PPO) (D) determined during the ramp incremental test. Pre- and post-supplementation data are presented as circles and triangles, respectively. Significant interaction effects are denoted by *P < 0.05.

