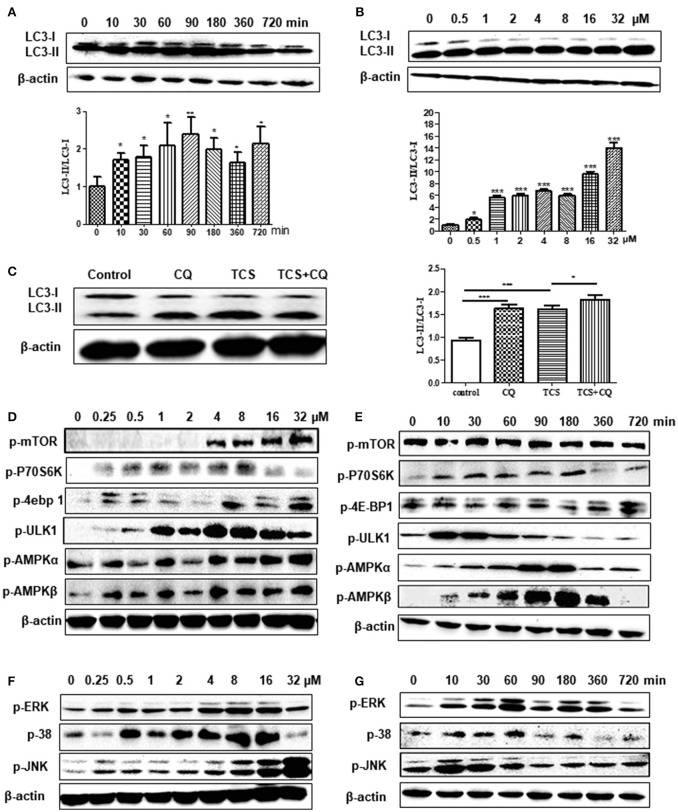
Figure 1.
TCS treatment induces an autophagic response in MΦ. RAW264.7 cells were treated with TCS (8 μM) for different times ranging from 0 to 720 min. Western blotting was used to assay the expression of LC3 (A). RAW264.7 cells were treated with TCS at different doses ranging from 0.5 to 32 μM for 90 min. Western blotting was used to assay the expression of LC3 (B). RAW264.7 cells were pretreated with or without CQ (25 μM, 60 min) and were then treated with or without TCS (8 μM) for 90 min. The results was assayed by western blot (C). RAW264.7 cells were treated with TCS at concentrations ranging from 0.25 to 32 μM for 90 min. The levels of phosphorylation of mTOR, p76S6K, 4E-BP1, AMPK-α, AMPK-β, and ULK1 (D) or JNK, ERK, and p38 (F) were assayed by western blot. RAW264.7 cells were treated with TCS (8 μM) for different times ranging from 0 to 720 min. The levels of phosphorylation of mTOR, p76S6K, 4E-BP1, AMPK-α, AMPK-β, and ULK1 (E) or JNK, ERK, and p38 (G) were assayed by western blot. Compared to the respective controls, *p < 0.05, **p < 0.01, ***p < 0.001.

