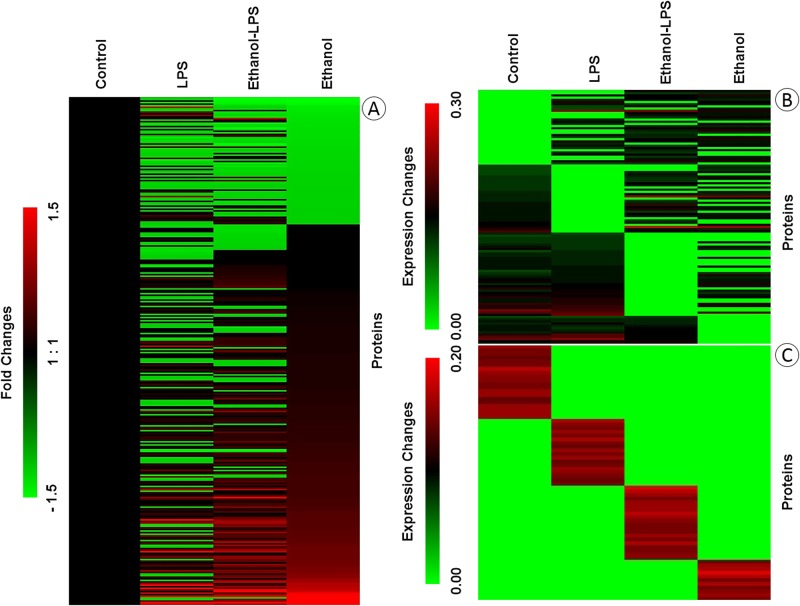
Fig 1. Heat maps depicting the changes in protein expression in RAW 264.7 macrophages during ethanol and/or LPS treatment.
Heat maps were generated by MeV software using the normalized intensities of high confidence Peptide Spectra Matches (PSMs) for identified proteins. Proteins common to all exposures are displayed as fold changes in (A), proteins common to three conditions as expression changes in (B), and proteins exclusive to one treatment condition as expression changes in (C). The detail information of the protein expressions was provided in S2 Table.

