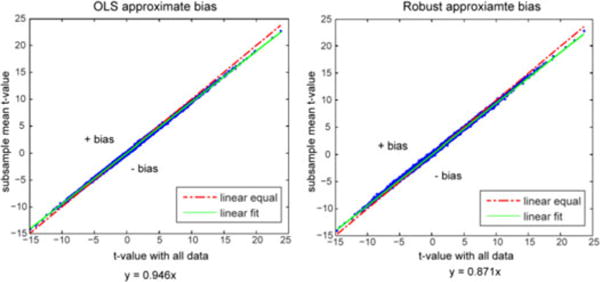
Fig. 3.

Illustration of consistency estimation. The mean t-value of random subsamples with 10% diminished data (vertical) is plotted versus the t-value with all data (horizontal). The left plot displays the OLS estimates and the right shows the M -estimates. The dashed line indicates equality (y = x); the data points above the dashed line have positive bias and the points below the dashed line have negative bias. The solid line is the estimated regression line from all the data points in each plot.
