
Fig. 6.
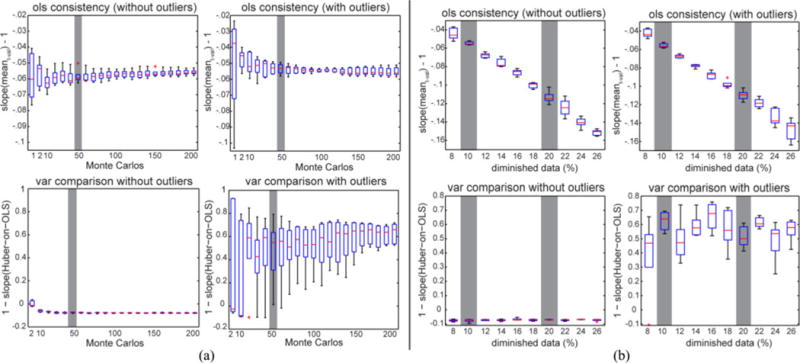
Influence of resilience parameter. (a) shows the impact of the number of Monte Carlo repetitions with 10% diminished data. (b) shows the impact of the diminished data size level when we performed 50 Monte Carlos each time. The OLS consistency plots display the slope βmean − 1 in (2). The variance comparison plots display 1 − βvar, where βvar is the slope of variance from robust estimation on OLS. “With\without artifacts” indicates if there are simulated outlier scans in the simulation.