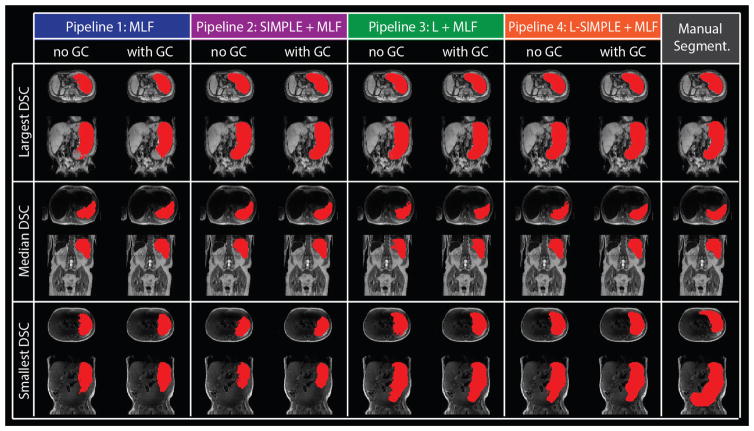
Fig. 5.
The qualitative results of four pipelines on the three subjects with largest, median and smallest DSC of Pipeline 4 with GC were shown with manual segmentation. For each pipeline, the “no GC” indicated the results without Graph Cuts while the “with GC” demonstrated the results with Graph Cuts.

