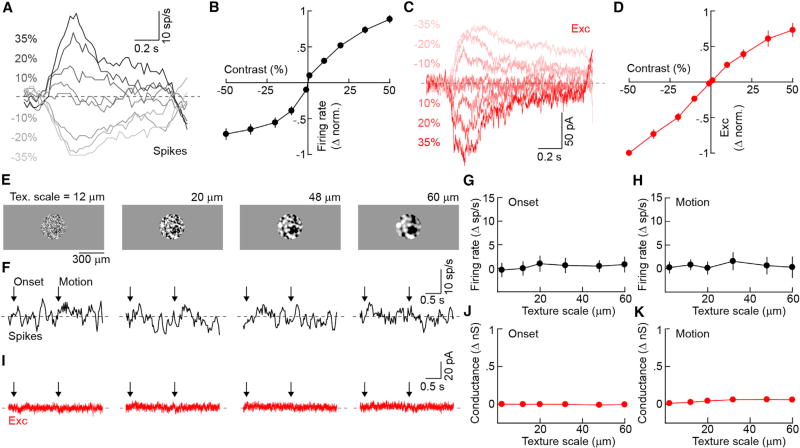
Figure 2. Linear Contrast Response Functions and Linear Spatial Integration of PixON-RGCs.
(A and C) Representative spike (A) and EPSC (C) responses to contrast steps presented in a 300-µm circle centered on the soma of the recorded cell.
(B and D) Contrast response functions of normalized spike rate (B, n = 13) and excitation (D, n = 6). Circles (error bars) indicate means (±SEMs) of the respective populations.
(E) Representative texture stimuli of different spatial scales masked in a 300-µm circle. Textures appeared from a gray background (onset) and were then translated 33 µm in either the dorsal, ventral, nasal, or temporal direction (motion). Textured regions were of the same mean luminance as the background.
(F and I) Representative spike (F) and excitatory (I) responses of a PixON-RGC to presentation of textures of the spatial scales shown in (E).
(G and H) Summary data of PixON-RGC spike responses to the onset (G) and motion (H) of texture stimuli of different spatial scales. Circles (error bars) indicate means (±SEMs) of the population (n = 13).
(J and K) Analogous to (G) and (H), respectively, for excitation (n = 3).
See also Figures S3–S5.

