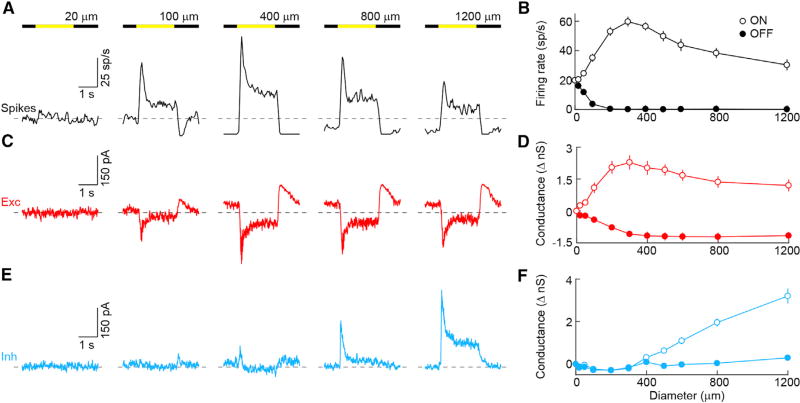
Figure 3. Spatial receptive fields of PixON-RGCs.
(A, C, and E) Representative spike (A, black), EPSC (C, red), and IPSC (E, cyan) responses to square-wave modulation (2 s ON, 2 s OFF) of circles of varying diameter. Dashed lines show baselines in the absence of stimulus.
(B, D, and F) Firing rates (B, n = 22) and changes in excitatory (D, n = 9) and inhibitory conductances (F, n = 9) during ON (open circles) and OFF (filled circles) plotted as a function of stimulus diameter. Circles (error bars) indicate means (±SEMs) of the respective populations.
See also Figure S4.

