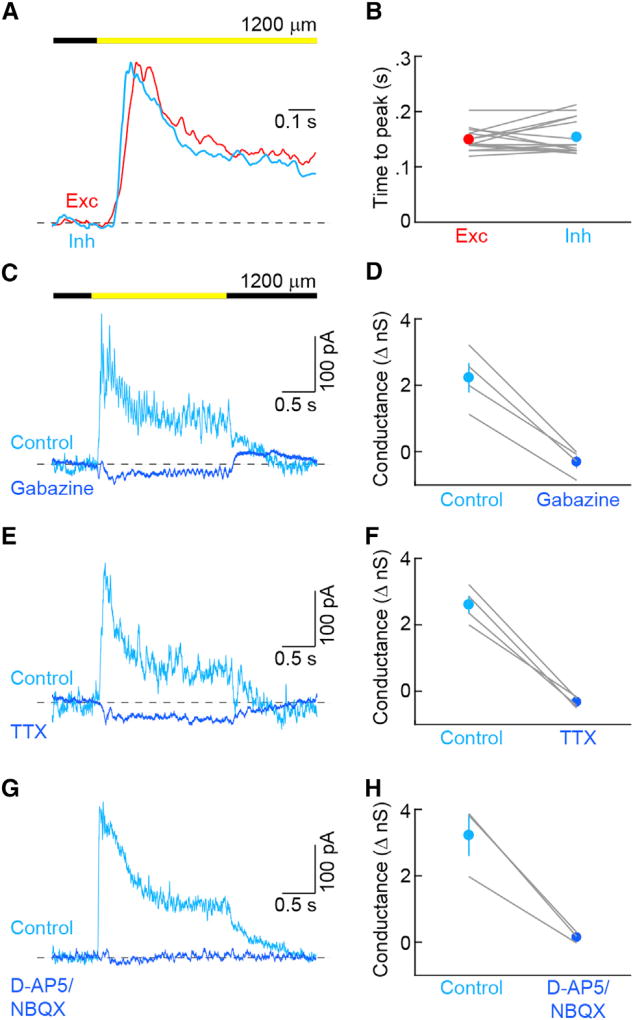
Figure 4. Kinetics and Mechanisms of PixON-RGC Inhibition.
(A) Representative normalized excitatory (red) and inhibitory (cyan) conductances in response to presentation of a 1,200-µm circle.
(B) Time from stimulus onset to peak of excitatory (n = 15) and inhibitory (n = 15) currents in response to presentation of a 1,200-µm circle (p = 0.544).
(C) Representative IPSCs in control (cyan) solution and in the presence of the GABAA receptor antagonist gabazine (blue) evoked by square-wave modulation (2 s ON, 2 s OFF) of a 1,200-µm circle.
(D) Summary data of inhibitory conductance under control conditions (cyan) or in the presence of gabazine (blue, n = 4, p < 0.004). Lines indicate results from individual cells, whereas circles (error bars) indicate the means (±SEMs) of the respective population.
(E and F) Analogous to (C) and (D), respectively, but for tetrodotoxin (TTX, n = 4, p < 0.003).
(G and H) Analogous to (C) and (D), respectively, but for NMDA (D-AP5) and AMPA (NBQX) receptor antagonists (n = 3, p < 0.03).

