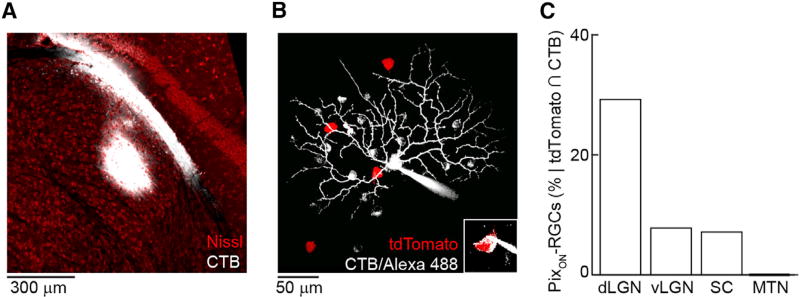
Figure 7. Retrograde Tracing of PixON-RGCs’ Axonal Projections.
(A) Representative cholera toxin subunit B (CTB) injection primarily in the core of dLGN.
(B) Morphology of a tdTomato and CTB positive (inset) cell targeted, recorded, and filled following injection of CTB into dLGN in a Grik4-Cre:Ai9 mouse.
(C) Percentage of recorded cells that were both tdTomato and CTB positive and had physiological and morphological properties of PixON-RGCs following CTB injection into different brain regions (dLGN: 19/65 cells; vLGN: 3/38 cells; SC: 1/14 cells; MTN: 0/10 cells).

