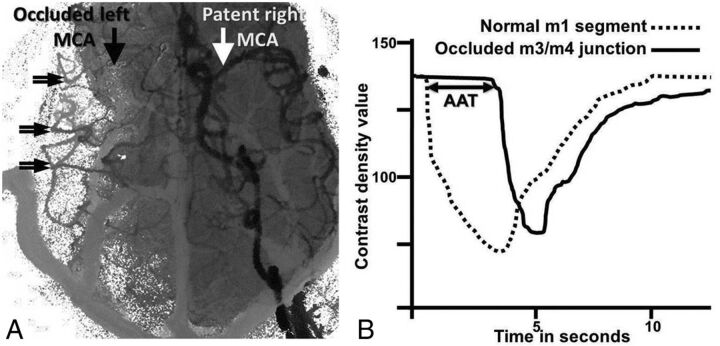
Fig 1.
Arterial arrival times measured from angiographic time-density curves. ROIs within the normal MCA proximal M1 segment (white arrow, A) and from collateralized MCA branches (double arrows, A) are identified on composite angiographic images. ROIs were used to calculate time-density curves (B). “Average arterial time” (in seconds) was defined as the time interval between contrast arrival at the normal M1 segment (interrupted curve, B) and the average of 3 ROIs at the M3/4 junction of the MCA corresponding to the occluded MCA (continuous curve, B). AAT is graphically depicted by the horizontal double arrow line.

