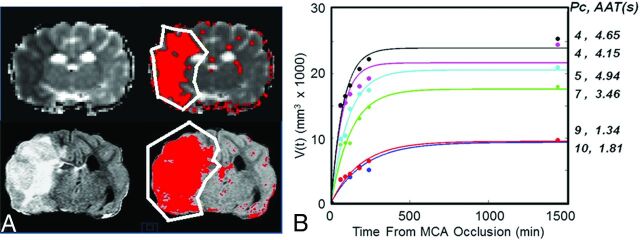
Fig 3.
Single-section 120-minute mean diffusivity (upper part) and 24-hour FLAIR (lower part) images (A) were used to estimate and plot the growth of the infarct volume with time (B). A semiautomated algorithm was used to estimate the volume of the infarct on the basis of signal intensity within the affected hemisphere (red area), varying 1.5 times the SD from the mean of the signal in the contralateral normal-appearing hemisphere exclusive of spinal fluid. B, Infarct volume growth with time follows a predicable trend. Each curve corresponds to 1 experiment. The pial collateral scores and AAT measured immediately after occlusion (ie, at t = 15 minutes) for each curve are listed on the right.

