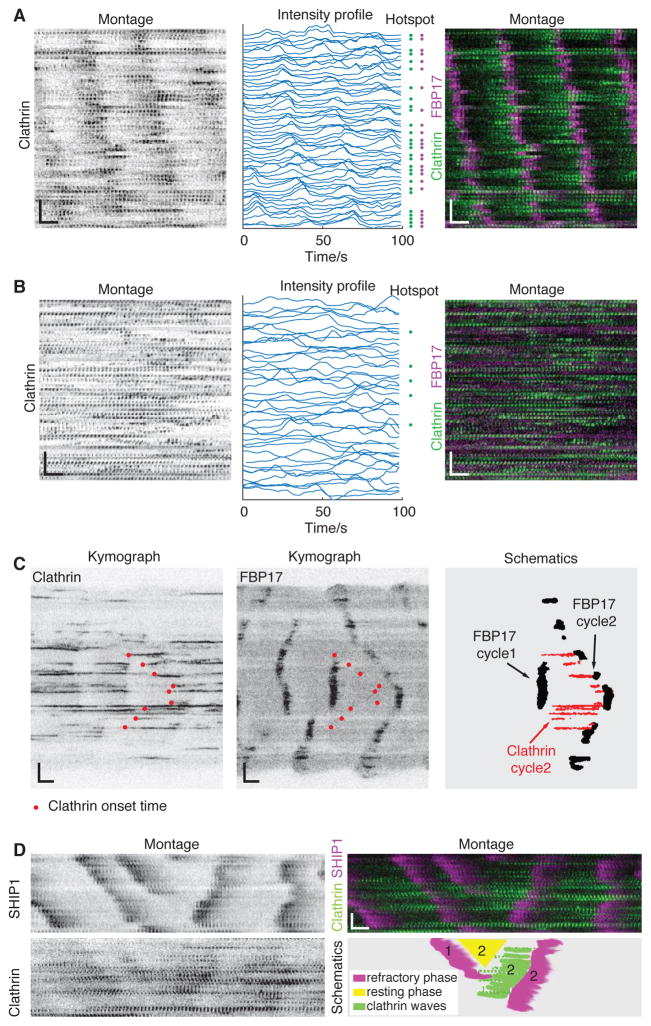
Figure 3. Clathrin Waves Emerge from Coordinated Assembly and Act Upstream of Cortical Waves.
(A) CCPs in a single cell with clathrin waves sorted by the coordinates of the pits along the direction of wave propagation. Left, single channel CCP montage. Middle, corresponding line profiles of each single pit. Blue dots at the right side indicate the corresponding line is hotspot positive. Right, merged montage of FBP17 (magenta) and clathrin (green).
(B) CCPs in a single cell without clathrin waves sorted by the coordinates of the pits. Left, single channel CCP montage. Middle, corresponding line profiles of each single pit. Blue dots at the right side indicate the corresponding line is hotspot positive. Right, merged montage of FBP17 (magenta) and clathrin (green).
(C) Kymographs of diverted waves of mCherry-clathrin (left) and the corresponding FBP17-EGFP (middle) and a schematic illustration of the relationship between a cycle of clathrin waves (red) with two neighboring cycles of a FBP17 wave (black) (right). Red dots in kymographs indicate the initiation points of CCPs in the diverted waves.
(D) Montages of diverted waves of CLC-GFP (upper left), the corresponding mCherry-SHIP1 (lower left), and the merge of the two with CLC in green and SHIP1 in magenta (upper right), and a schematic illustration of the relationship between a cycle of clathrin waves (green) with two neighboring cycles(‘1’ marks the previous cycle and ‘2’ marks the current cycle) of refractory phase markers (magenta) and a resting phase (yellow) (lower right).
Inverted look-up table was used in all single channel montages. Scale bars in montages represent 10 s (horizontal) and 5 μm (vertical).

