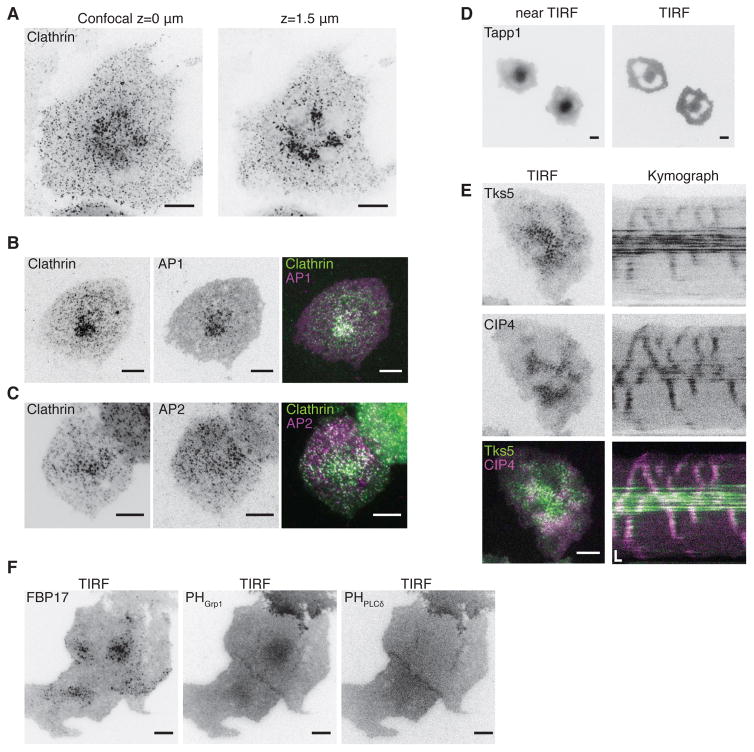
Figure 7. The Intracellular Pool of Clathrin and PI(3,4)P2 defines a Non-excitable Vortex Core.
(A) Confocal view of the center cluster of mCherry-CLC. Left, bottom surface. Right, 1.5 μm above the surface.
(B) TIRF image of a cell transfected with mCherry-CLC and AP1σ1-EGFP. Right, merged image of CLC (green) and AP1 (magenta).
(C) TIRF image of a cell transfected with CLC-EGFP and AP2μ2-mCherry. Right, merged image of CLC (green) and AP2 (magenta).
(D) Near-TIRF (left) and TIRF (right) view of RFP-PH-Tapp1. Near-TIRF is achieved by elevating the incident angle.
(E) Representative TIRF images and kymograph of Tks5-GFP (top) and mCherry-CIP4 (middle) in the center cluster in a cell bearing waves. Bottom, merged image of Tks5 (green) and CIP4 (magenta).
(F) TIRF image of the cell co-expressing FBP17-EGFP (left) and mCherry-Grp1-PH (middle) and iRFP-PH-PLCδ (right).
Inverted look-up table was used in all single channel images/montages. Scale bars in all whole cell images represent 10 μm. Scale bars in kymographs represent 10 s (horizontal) and 5 μm (vertical).

