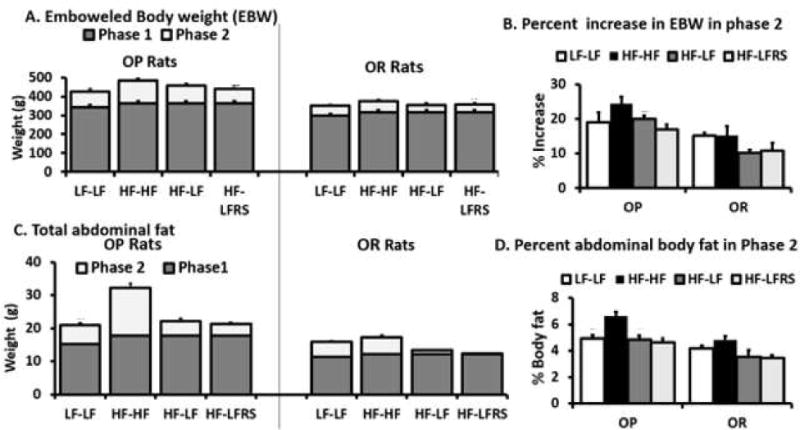
Figure 3. Body weight and body fat.

A. Weight of the GI tract contents was subtracted from total body weight to determine emboweled body weight (EBW) for OP and OR rats. B. Percent increases in EBW as phase 2/phase 1*100. C. Total abdominal fat. D. Percent abdominal fat (abdominal fat/EBW*100) after phase 2. In A and C data for the lower darker bars was determined from the 4 animals per LF and HF diet groups euthanized after phase 1. Data for the upper lighter bars was determined from the 6 animals per group after phase 2. The only a priori difference after phase 2 for A-D was between OPHF-LFRS vs. ORHF-LFRS (P<0.0125). There were no significant differences for OPHF-LFRS vs OPHF-LF, OPHF-LFRS vs OPLF-LF and ORHF-LFRS vs ORHF-LF.
