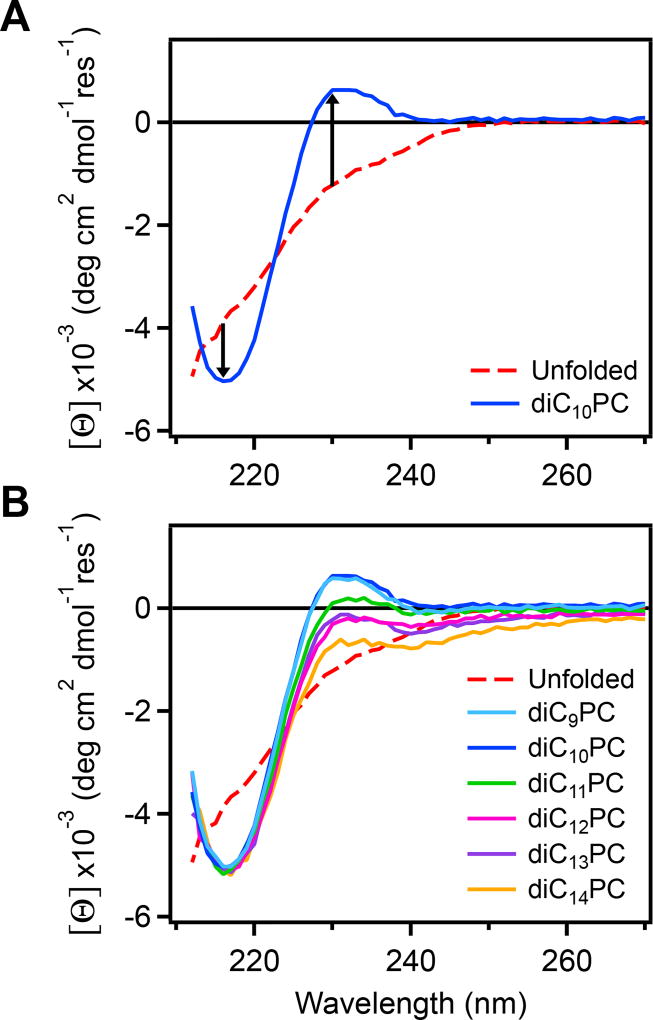
Figure 3.
CD wavelength spectra of OmpA171 in various lipids collected after kinetics measurements. Curves were corrected with the corresponding LUV spectrum (Figure S6), and converted to mean residue ellipticity using the concentration measured before kinetics. Each plot also contains the spectrum for unfolded OmpA171 in 1 M urea as a dashed red line. (A) Spectrum after folding into LUVs of diC10PC for 5 h (blue). Arrows indicate the change in signal at 216 nm and 230 nm from the unfolded state. (B) Spectra after folding into LUVs of diC9PC – diC14PC for 5 h at 25 °C. The trough at 216 nm is indicative of β-sheet structure and the peak at 230 nm is thought to be due to an exciton interaction between aromatic residues in the native state.

