Figure 5.
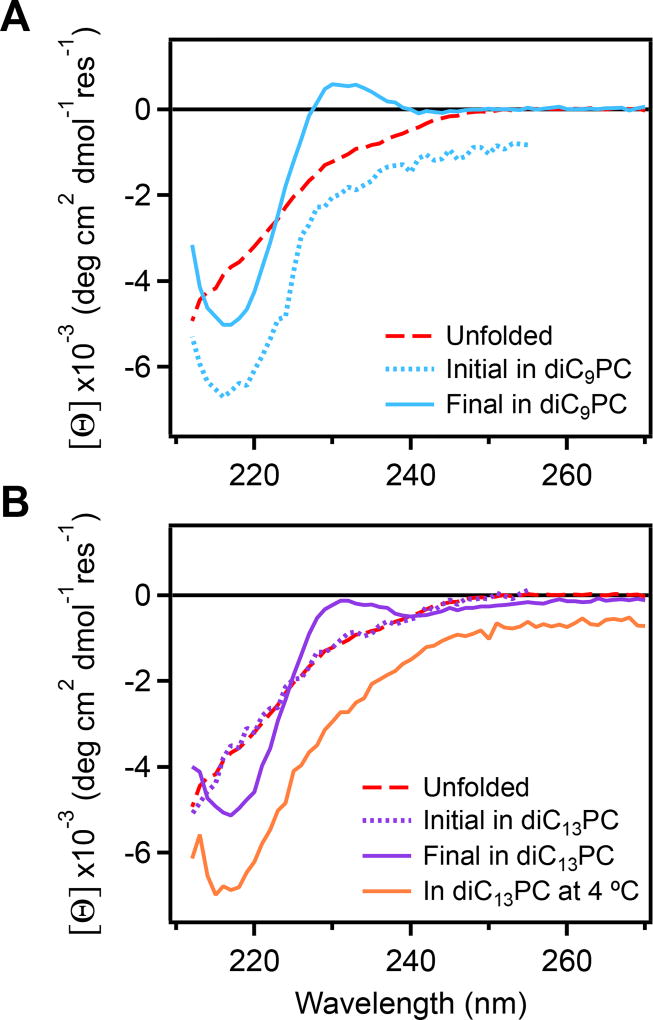
CD wavelength spectra of OmpA171 immediately after initiating folding into LUVs of (A) diC9PC, or (B) diC13PC (dotted lines) at 25 °C, and after incubation with diC13PC at 4 °C (B; orange line). “Initial” wavelength data were collected in 10 nm sections to capture the signal at the earliest times possible, and then combined into a full spectrum. The spectrum at 4 °C (B) was collected at the conclusion of kinetics measurements at 4 °C, and scaled by a factor of 1.25 to correct for the temperature dependence of the signal (see Supporting Information). Also included in each plot for comparison are the spectrum for unfolded OmpA171 (dashed red line), and the spectrum measured after folding was complete in the corresponding lipid at 25 °C (solid light blue and purple lines), from Figure 3B.

