Fig. 1.
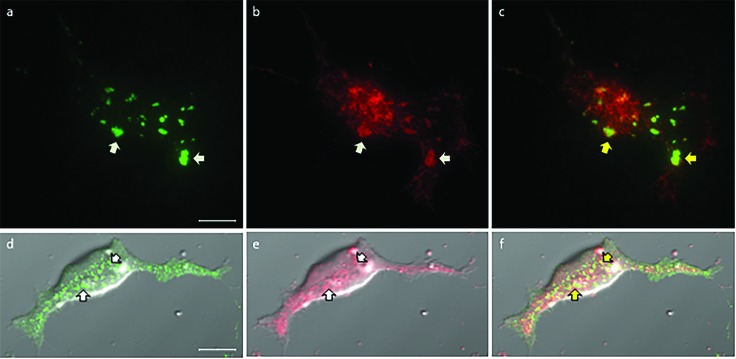
[(a)–(c)] TIRF microscopy images of biotinylated Kv2.1, detected by fluorescent (CF640) streptavidin binding to the biotin moiety attached to an extracellular domain on the Kv2.1 channel, and DsRed2-ER in the endoplasmic reticulum. Arrows specify the regions where the Kv2.1 clusters on the cell surface overlap with the DsRed2-ER near the plasma membrane. (a) Clusters of Kv2.1 were present on the bottom surface of the cell adjacent to the glass substrate. (b) Bright red patches denote the endoplasmic reticulum tubules within the TIR illumination field. (c) Overlay of both fluorescence signals. [(d)–(f)] Confocal fluorescence microscopy images of HEK cells that were transfected to express GFP-Kv2.1 and labeled with ER-Tracker. Arrows indicate the regions where the green and red fluorescence overlaps. (d) On the bottom surface of the representative cell, the GFP-labeled Kv2.1 ion channels formed clusters with sizes that ranged from 700 nm to 2 μm. These clusters associate with junctions between the plasma membrane and endoplasmic reticulum. (e) Fluorescence microscopy images of the ER-Tracker that locate the endoplasmic reticulum. (f) Merging the two fluorescence images and visualizing them on top of the bright-field optical image produce yellowish-green features that indicate partial colocalization between GFP-Kv2.1 clusters and the endoplasmic reticulum, as indicated by the yellow arrows. All scale bars are 10 μm.

