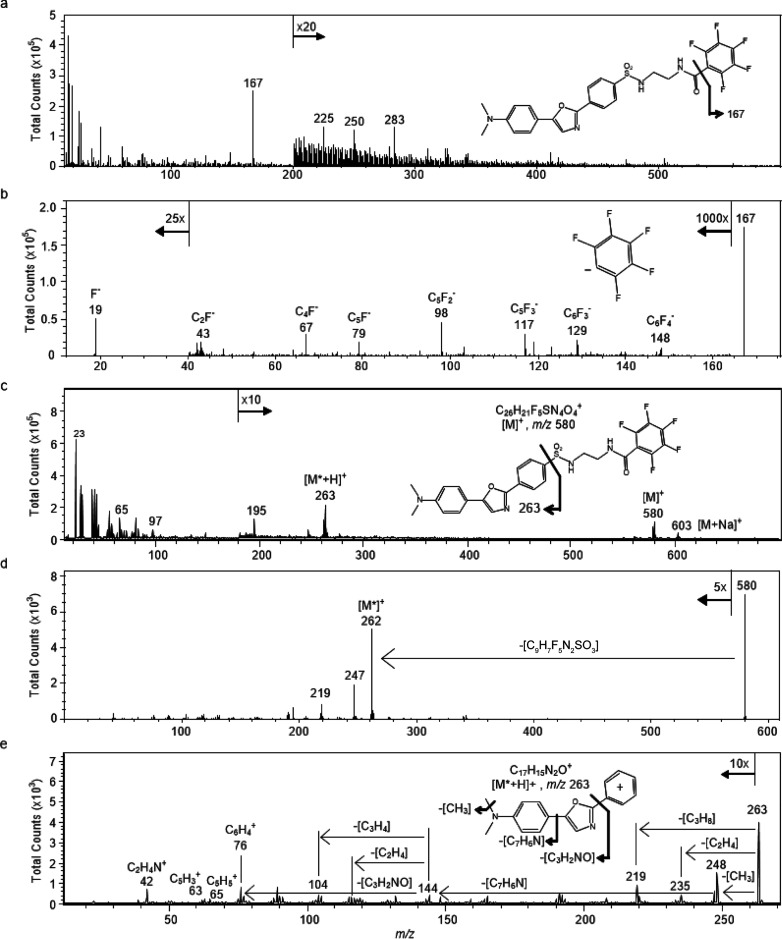
Fig. 2.
Ionization and fragmentation of ER-Tracker standard were performed to identify characteristic fragments that might be used to image its distribution in cells using SIMS. (a) Full negative ion spectrum of ER-Tracker standard with the structure of the intact molecule (inset). (b) Product ion spectrum of the precursor ion m/z 167 contained fluoride ions at m/z 19 and several less intense fluorocarbon fragment ions, which confirms that the m/z 167 precursor ion was the pentafluorophenyl anion. (c) Full positive ion spectrum of the ER-Tracker standard. The inset shows the structure of the intact ER-Tracker molecule, where the fragment that corresponds to the fragment ion with m/z 263 is indicated. (d) Product ion spectrum of the molecular ion (C26H21F5N4O4S) at m/z 580. (e) The peaks in the product ion spectrum of the precursor ion m/z 263 result from the loss of CO, fragments of the N,N-dimethyl moiety, N,N-dimethylaniline, and aromatic ring fragments. This fragmentation pattern confirms that the precursor ion at m/z 263 was the Dapoxyl dye cation. The inset illustrates its fragmentation.

