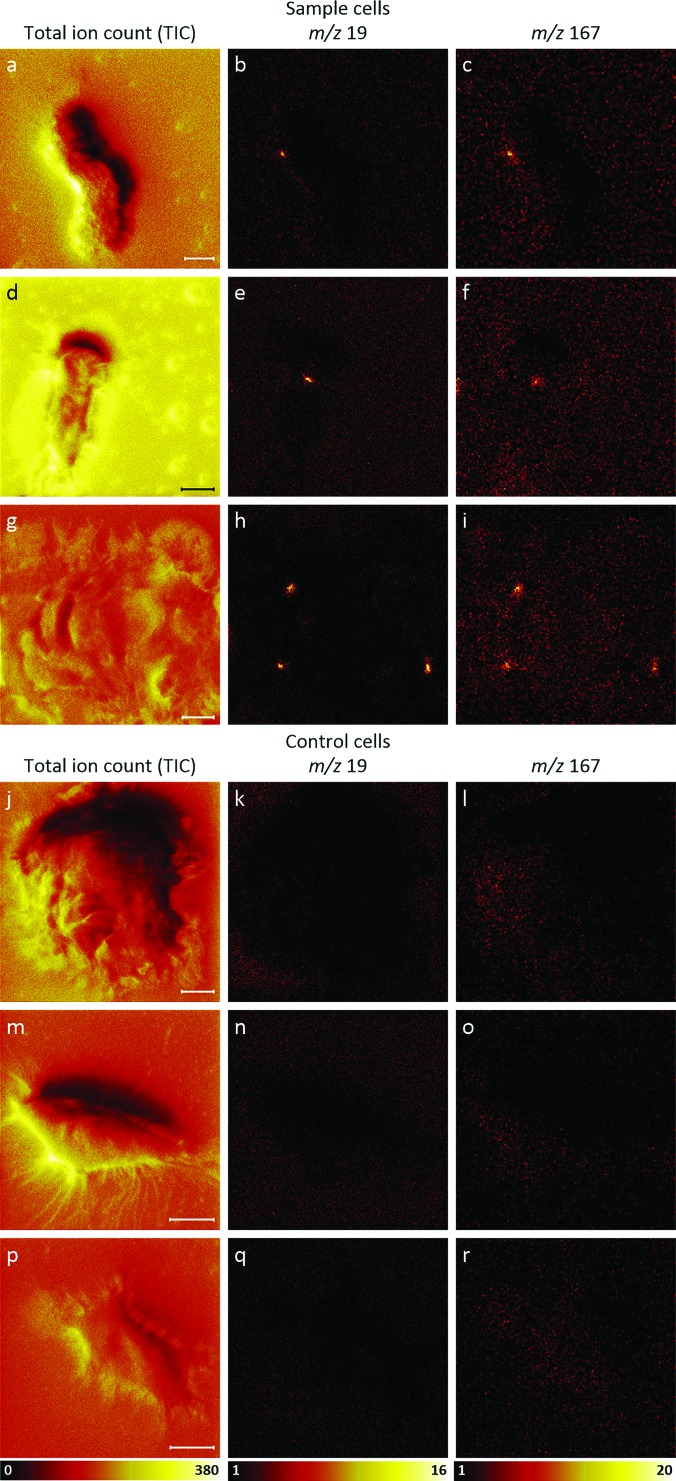
Fig. 3.
TOF-SIMS tandem MS negative ion images of three transfected, ER-Tracker stained cells and three unstained (control) cells that were not transfected. Images of the [(a), (d), and (g)] TIC, [(b), (e), and (h)] m/z 19 signals, and [(c), (f), and (i)] m/z 167 signals acquired from each sample cell reveal colocalized hotspots of fluoride and pentafluorophenyl ions, respectively, from the ER-Tracker stain on each cell. Comparison between the ion images and the corresponding TIC images shows that these hotspots are not regions where all the negative ion signals were elevated. Images of the [(j), (m), and (p)] TIC, [(k), (n), and (q)] m/z 19 signals, and [(l), (o), and (r)] m/z 167 signals acquired on each of the three control cells show no local elevations in these two ER-Tracker-associated ions on the cells. The m/z 19 ion images in this figure were binned to 256 × 256 pixels, and the m/z 167 ion images in this figure were binned to 128 × 128 pixels for better visualization. All scale bars are 10 μm.

