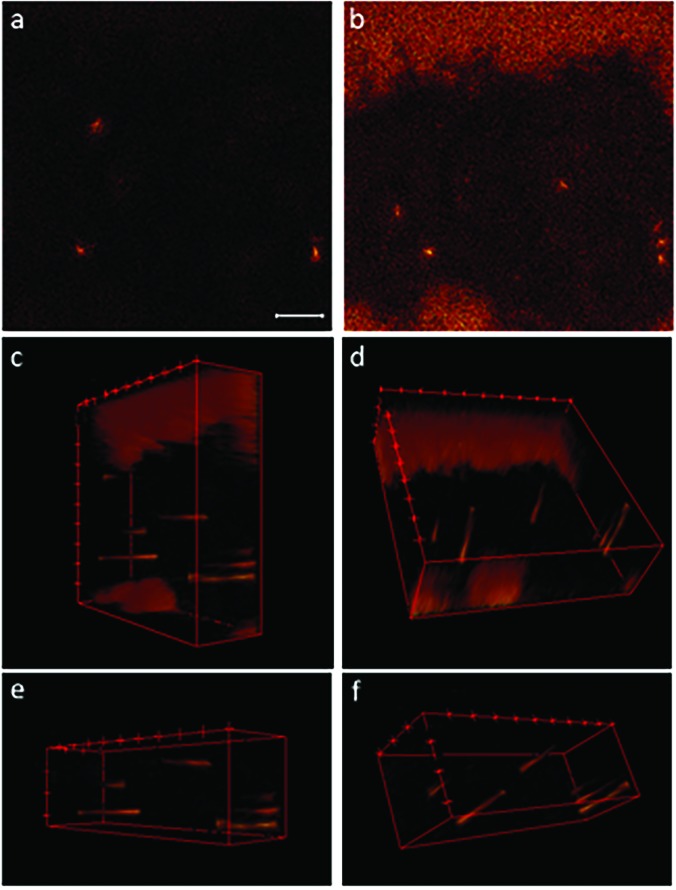
Fig. 4.
Individual images and 3D image stacks compiled from 3D depth profile data show the m/z 19 signals at the surface of a transfected HEK cell and at distances up to approximately 40 nm below the surface. Pixel binning was not applied to these images. The image that corresponds to the top (a) of the 3D stack shows the m/z 19 fluoride ions that locate the ER-Tracker on the cell surface. The last m/z 19 ion image acquired at approximately 40 nm below the cell surface (b) reveals additional hotspots inside the cell. 3D image stacks of the full FOV [(c) and (d)] and a smaller region within the cell [(e) and (f)] show that the elevated m/z 19 signals were detected in cylindrical regions that appear at different distances from the cell surface. These cylindrical morphologies are consistent with endoplasmic reticulum tubules that occasionally form ER-PM junctions. The scale bar is 10 μm.

