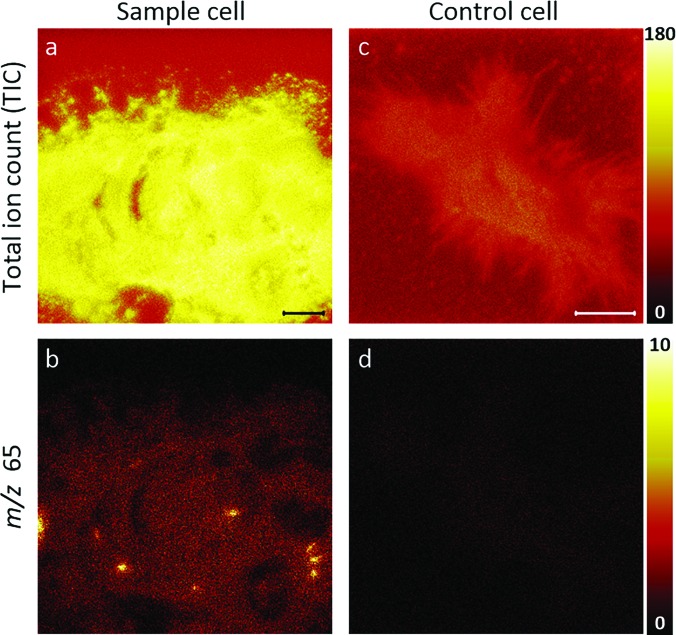
Fig. 6.
Unbinned TOF-SIMS positive ion images of a transfected, ER-Tracker stained cell [(a) and (b)] and an unstained (control) cell that was not transfected [(c) and (d)]. Images of the (a) TIC and (b) m/z 65 signals acquired from the transfected cell. The local elevations in m/z 65 signals shown in (b) correspond to the same locations where the m/z 19 hotspots were detected on this cell [Fig. 4(b)]. This colocalization suggests that the m/z 65 signals might be cyclopentadienyl ions [C5H5]+ from the ER-Tracker stain or some other component that is found in endoplasmic reticulum tubules. Consistent with these possibilities, images of the (c) TIC and (d) m/z 65 signals acquired on the control cell show no local elevations in the m/z 65 signals. Scale bars are 10 μm.

