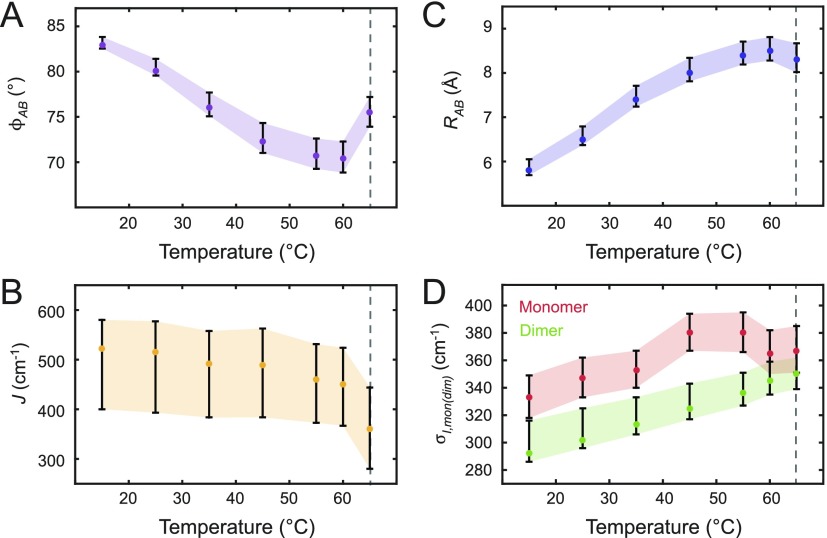
FIG. 7.
Temperature-dependent optimized parameters from (Cy3)2 dimer absorption and CD spectra. Error bars were calculated based on a 1% deviation of the target function from its optimized value. The dashed line at 65 °C indicates the melting transition temperature Tm of the DNA constructs. (a) Inter-chromophore twist angle; (b) resonant electronic coupling parameter; (c) inter-chromophore separation; and (d) spectral inhomogeneity parameter associated with the Cy3 monomer and the (Cy3)2 dimer DNA constructs.

