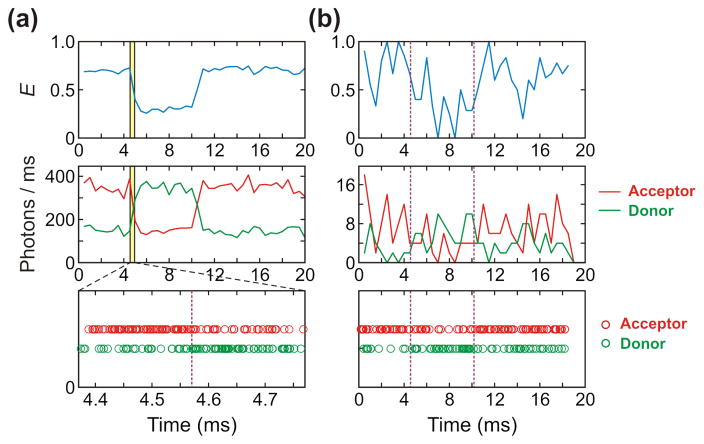
Figure 2.
Photon (Bottom), binned fluorescence (Middle) and FRET efficiency (Top) trajectories simulated with (a) high (500 ms−1) and (b) low (10 ms−1) photon count rates and the FRET efficiencies of 0.7 and 0.3. The FRET efficiency (E) is the fraction of photons in a bin that are emitted by the acceptor (E = nA/(nA + nD), where nA is the number of acceptor photons and nD is the number of donor photons). The bin time of the FRET efficiency and fluorescence trajectories is 0.5 ms. Purple vertical dashed lines indicate positions of transition between folded and unfolded states. Transition time points are the same in (a) and (b). The photon trajectory in (a) shows photons near the first transition (yellow shaded area in the binned trajectory).

