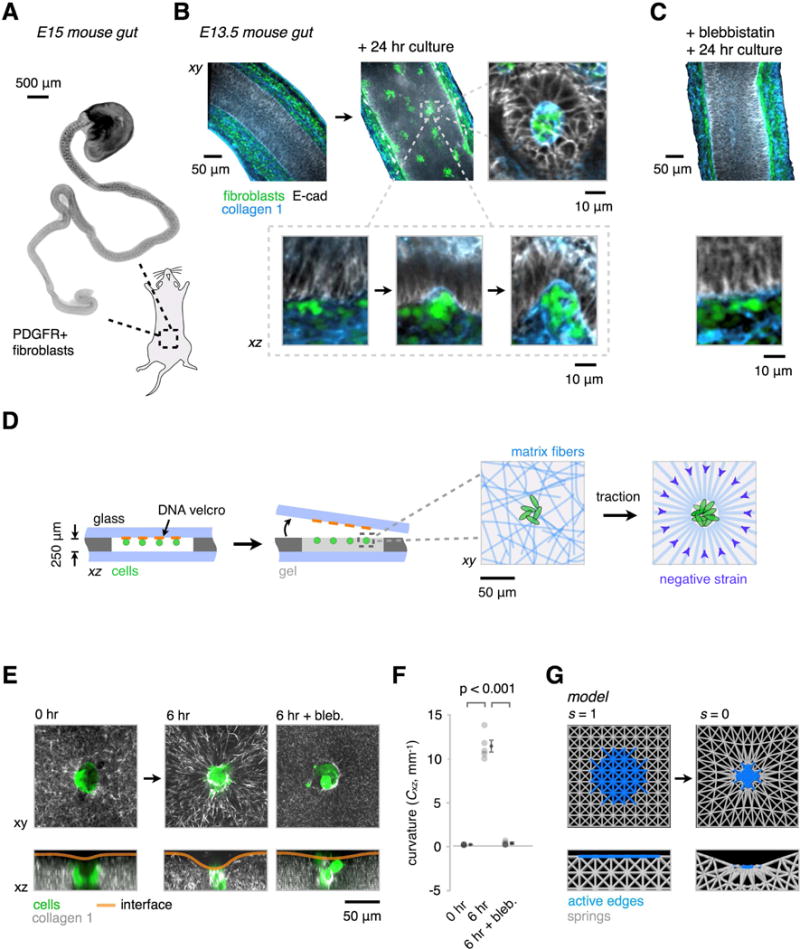
Figure 2. Signatures of Mesenchymal Condensation in the Mouse Gut, and their Reconstitution In Vitro and In Silico.

(A) Whole-mount wide-field fluorescence microscopy image of the embryonic day 15 (E15) mouse intestine showing PDGFR+ fibroblast clusters forming in an anterior to posterior wave.
(B) Optical sections from whole-mount confocal immunofluorescence images showing PDGFR+ cells (green) and collagen I fibers (blue) in E13.5 explants cultured for 0 or 24 hr in vitro. Detail shows intermediate stages of PDGFR+ cluster formation against the basal surface of the epithelium (E-cadherin, gray), along the wave of condensation. Successive stages of cluster formation show progressive collagen I accumulation and localized curvature at the basal surface of the epithelium (see also Figure S2).
(C) Intestine explant cultures as in (B) show reduced cell clustering, collagen I accumulation, and interface curvature in the presence of 30 μM blebbistatin (a myosin II inhibitor). See Figure S2A-C for further quantitation.
(D) Schematic of reconstitution strategy using DNA-programmed assembly of cells (DPAC) to build loose clusters of mesenchymal cells near the surface of ECM gels containing collagen I and matrigel. Detail at right illustrates the hypothesized traction-mediated compaction and alignment of ECM fibers around cell clusters.
(E) GFP-expressing MEF clusters (green) were patterned in AF555-labeled collagen I-containing gels (gray) as in (D). Live confocal microscopy of condensing clusters and collagen I reveals ECM compaction, radial collagen I fiber alignment, and the emergence of curvature of the gel-medium interface (see also Figure S3). These phenomena are blocked by treatment with 30 μM blebbistatin.
(F) Quantification of the interfacial curvatures proximal to the condensates shown in (E) (mean ± SEM, n = 5, one-way ANOVA with Holm-Sidak’s multiple comparisons test).
(G) Snapshots from a finite-element model containing passive elastic elements (gray) and active edges (blue) whose length s can be reduced to simulate local gel strains by cell clusters.
