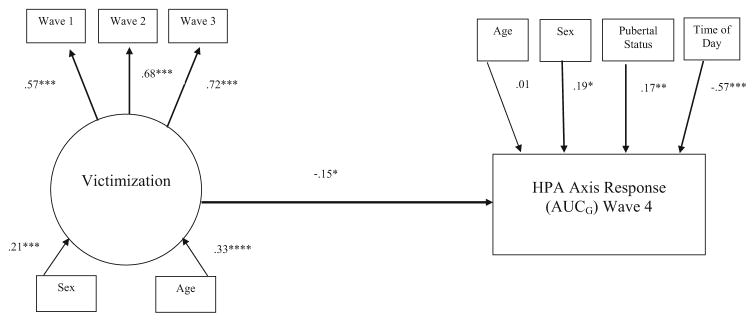
Fig. 1.
Relationship between victimization and HPA axis response controlling for the contributions of youth sex and age on victimization, and the contributions of youth sex, age, pubertal status at Wave 1, and time of day of data collection on cortisol responses. Standardized parameter estimates are presented in the figure. N = 237, χ2 (12) = 13.60, p >.05; RMSEA = .024 CI [0, .073]; CFI = .994; TLI = .989; SRMR = .027

