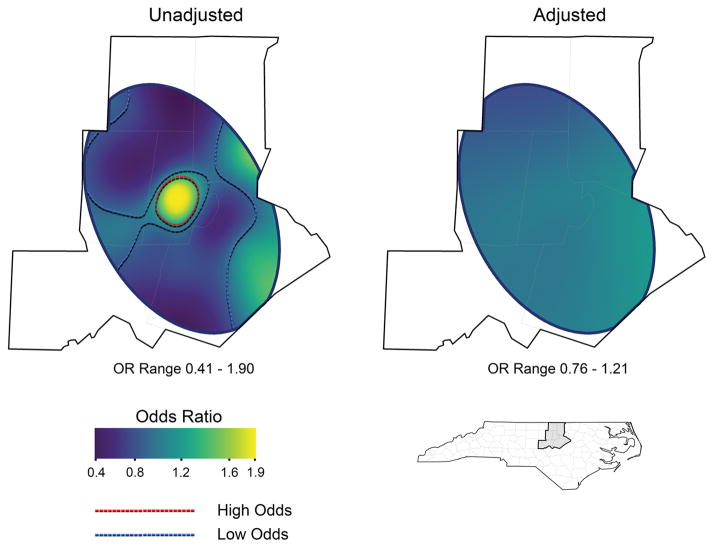
Figure 1.
Generalized additive models showing the geographic heterogeneity of maternal CMV seropositivity. In the unadjusted model maternal CMV is compared only to smoothed effects of longitude and latitude. The local odds ratio in the unadjusted model varied from 0.41 to 1.90 compared with the average odds. The odds of CMV seropositivity were significantly higher than average in the urban neighborhoods of Durham, while they were significantly low in the more affluent suburbs. The adjusted model included both neighborhood level ADI and an interaction term for individual age and race. This adjustment substantially blunted the odds ratio range (0.76 to 1.21) and effaced much of the geographic variability of CMV odds. Thus, the combination of neighborhood ADI and individual age and race statistically explains much of the distribution of CMV seropositivity.

